
Tape Diagrams for Algebra (with examples) by kapil123 (2)
Loading the math board and drawing, please wait…
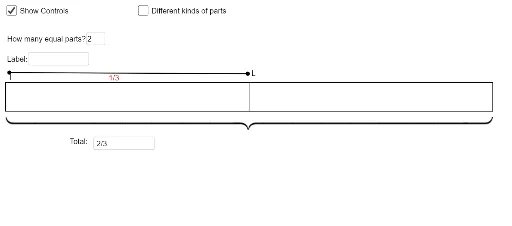
This GeoGebra example demonstrates how tape diagrams (bar models) can be used to model and solve algebraic problems, turning abstract quantitative relationships into visual geometric representations. Core mathematical concepts include algebraic expressions, equations, proportional reasoning, and elements of linear programming, along with statistical measures like median and expected value. The construction uses GeoGebra commands such as Textfield, Polygon, Point, Segment, Midpoint, and Sequence, with multiple input boxes (InputBox1-5) and text objects (text1-7) to create interactive bars. It is suitable for middle school algebra instruction, helping students grasp the geometric meaning of equations and inequalities, and can also serve as an introduction to statistics.
GeoGebra Commands & Parameters
Textfield(m) → InputBox1Textfield(text5) → InputBox2Textfield(n) → InputBox3Textfield(text6) → InputBox4Textfield(text7) → InputBox5Polygon(A, B, C, D) → poly1, a_1, b, c, dPoint(poly1) → ESegment(E, F) → fMidpoint(D, F) → GMidpoint(F, C) → HSequence(Segment[A + ((i_1 * (k - 1)), 0), A + ((i_1 * (k - 1)), h)], k, 1, m) → list1Sequence(Segment[E + ((i_2 * (p - 1)), 0), E + ((i_2 * (p - 1)), h)], p, 1, n) → list2Sequence(Segment[A + ((i_3 * (k - 1)), 0), A + ((i_3 * (k - 1)), h)], k, 1, m) → list3Sequence(Text[text6, (x(E) + (r * i_2) + i_2 / (n + 1), 0.7)], r, 0, n - 1) → list2tSequence(Text[text5, (x(A) + (q * i_3) + i_3 / (m + 1), 0.7)], q, 0, m - 1) → list3tSequence(Text[text5, (x(A) + (q * i_1) + i_1 / (m + 1), 0.7)], q, 0, m - 1) → list1tSegment(I, L) → i
AI Drawing Prompt Reference
Create a visual algebra teaching diagram using tape/bar models. Start with a large rectangle divided vertically into equal-width segments, each labeled with a number or variable. Beside it, draw another rectangle with a different division pattern to represent a related algebraic expression. Add text input boxes above or below the bars for entering variable values. The overall layout should clearly show how the bar lengths represent quantities in an equation or inequality, with multiple interactive input areas for adjusting parameters and observing changes.
The prompt above was compiled from the original drawing commands and is for reference only.