
Tape Diagrams for Algebra Examples by kapil123
Loading the math board and drawing, please wait…
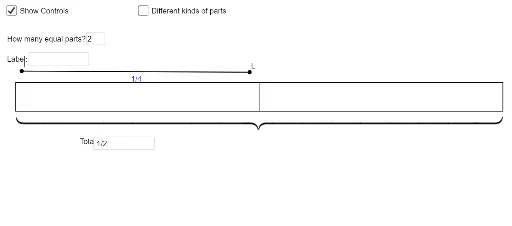
This example uses tape diagrams to demonstrate algebra problem-solving methods. It involves core algebraic concepts such as arithmetic operations. GeoGebra commands like Textfield, Polygon, Point are used for construction. Suitable for middle school and above students to learn visual problem-solving methods in algebra.
GeoGebra Commands & Parameters
Textfield(m) → InputBox1Textfield(text5) → InputBox2Textfield(n) → InputBox3Textfield(text6) → InputBox4Textfield(text7) → InputBox5Polygon(A, B, C, D) → poly1, a_1, b, c, dPoint(poly1) → ESegment(E, F) → fMidpoint(D, F) → GMidpoint(F, C) → HSequence(Segment[A + ((i_1 * (k - 1)), 0), A + ((i_1 * (k - 1)), h)], k, 1, m) → list1Sequence(Segment[E + ((i_2 * (p - 1)), 0), E + ((i_2 * (p - 1)), h)], p, 1, n) → list2Sequence(Segment[A + ((i_3 * (k - 1)), 0), A + ((i_3 * (k - 1)), h)], k, 1, m) → list3Sequence(Text[text6, (x(E) + (r * i_2) + i_2 / (n + 1), 0.7)], r, 0, n - 1) → list2tSequence(Text[text5, (x(A) + (q * i_3) + i_3 / (m + 1), 0.7)], q, 0, m - 1) → list3tSequence(Text[text5, (x(A) + (q * i_1) + i_1 / (m + 1), 0.7)], q, 0, m - 1) → list1tSegment(I, L) → i
AI Drawing Prompt Reference
Draw a tape diagram for algebra problem-solving. Start by drawing a rectangle, then add multiple equal segments inside it to represent algebraic expressions. Use input boxes to enter variables m and n, which control the number of segments and the division of the rectangle. Add text labels inside the rectangle to indicate different parts of the algebraic expressions.
The prompt above was compiled from the original drawing commands and is for reference only.