
Tape Diagrams for Algebra (Examples)
Loading the math board and drawing, please wait…
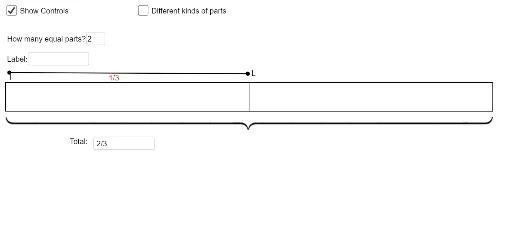
This example demonstrates how to use tape diagrams to represent and solve algebraic problems. Core math concepts include algebraic operations, proportional relationships, and geometric diagram representation. It utilizes GeoGebra commands and objects like Textfield, Polygon, Point, Segment, Midpoint, and Sequence. Suitable for middle school students and above learning algebra and geometric representations, or for teacher demonstrations.
GeoGebra Commands & Parameters
Textfield(m) → InputBox1Textfield(text5) → InputBox2Textfield(n) → InputBox3Textfield(text6) → InputBox4Textfield(text7) → InputBox5Polygon(A, B, C, D) → poly1, a_1, b, c, dPoint(poly1) → ESegment(E, F) → fMidpoint(D, F) → GMidpoint(F, C) → HSequence(Segment[A + ((i_1 * (k - 1)), 0), A + ((i_1 * (k - 1)), h)], k, 1, m) → list1Sequence(Segment[E + ((i_2 * (p - 1)), 0), E + ((i_2 * (p - 1)), h)], p, 1, n) → list2Sequence(Segment[A + ((i_3 * (k - 1)), 0), A + ((i_3 * (k - 1)), h)], k, 1, m) → list3Sequence(Text[text6, (x(E) + (r * i_2) + i_2 / (n + 1), 0.7)], r, 0, n - 1) → list2tSequence(Text[text5, (x(A) + (q * i_3) + i_3 / (m + 1), 0.7)], q, 0, m - 1) → list3tSequence(Text[text5, (x(A) + (q * i_1) + i_1 / (m + 1), 0.7)], q, 0, m - 1) → list1tSegment(I, L) → i
AI Drawing Prompt Reference
Create a tape diagram for algebra teaching. Start with a large rectangle divided into equal vertical strips by parallel line segments. Place input boxes near the rectangle for variables and numbers. Add points and segments to show proportional relationships, with text labels inside the strips. The diagram should clearly illustrate algebraic operations through geometric representation, suitable for classroom demonstration.
The prompt above was compiled from the original drawing commands and is for reference only.