
Tape Diagrams for Algebra (with examples) by artipal81 (3)
Loading the math board and drawing, please wait…
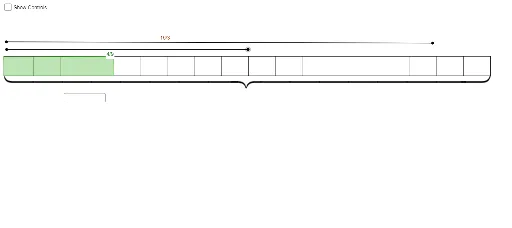
① This interactive GeoGebra example demonstrates how tape diagrams (bar models) can visually represent algebraic equations and inequalities, making abstract relationships concrete. ② Core math concepts include algebraic expressions, equations, inequalities, proportional reasoning, and the connection between geometric shapes and algebraic operations. ③ Construction uses GeoGebra commands such as Textfield for input boxes, Polygon for drawing bars, Point and Segment for key points and segments, Midpoint for midpoints, and Sequence for repeated structures, with objects like g, e, m, poly1, and list1 linked dynamically. ④ Suitable for middle and high school algebra instruction, helping students grasp variables, equation manipulation, and solution sets; ideal for classroom demonstrations or self-paced exploration.
GeoGebra Commands & Parameters
Textfield(m) → InputBox1Textfield(text5) → InputBox2Textfield(n) → InputBox3Textfield(text6) → InputBox4Textfield(text7) → InputBox5Polygon(A, B, C, D) → poly1, a_1, b, c, dPoint(poly1) → ESegment(E, F) → fMidpoint(D, F) → GMidpoint(F, C) → HSequence(Segment[A + ((i_1 * (k - 1)), 0), A + ((i_1 * (k - 1)), h)], k, 1, m) → list1Sequence(Segment[E + ((i_2 * (p - 1)), 0), E + ((i_2 * (p - 1)), h)], p, 1, n) → list2Sequence(Segment[A + ((i_3 * (k - 1)), 0), A + ((i_3 * (k - 1)), h)], k, 1, m) → list3Sequence(Text[text6, (x(E) + (r * i_2) + i_2 / (n + 1), 0.7)], r, 0, n - 1) → list2tSequence(Text[text5, (x(A) + (q * i_3) + i_3 / (m + 1), 0.7)], q, 0, m - 1) → list3tSequence(Text[text5, (x(A) + (q * i_1) + i_1 / (m + 1), 0.7)], q, 0, m - 1) → list1tSegment(I, L) → iSegment(M, N) → jPolygon(O, P, R, S) → q1, o, p, r, s
AI Drawing Prompt Reference
Create an interactive diagram using bar models to visually represent algebraic equations and inequalities, featuring input boxes for variable values, bars to show numerical relationships, and sliders for dynamic adjustments. Include text labels at key points and values, connecting geometric shapes with algebraic operations, suitable for educational demonstrations or self-exploration.
The prompt above was compiled from the original drawing commands and is for reference only.