
Visualizing Connections Among Multiple Algorithms for Multiplying Decimals
Loading the math board and drawing, please wait…
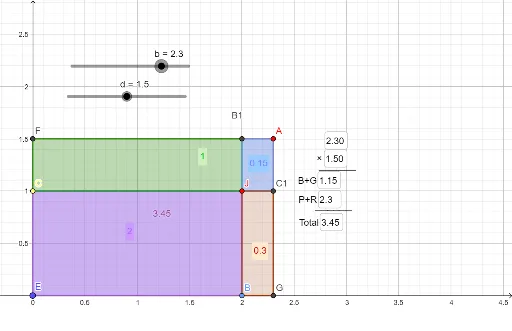
This GeoGebra example demonstrates how different algorithms for multiplying decimals are interconnected through an interactive geometric model. It uses points, polygons, and intersections to represent the multiplication process visually, making abstract arithmetic operations tangible. Core mathematical concepts include decimal multiplication, area models, place value decomposition, and algorithmic equivalence. The construction employs commands such as Point, Polygon, PointIn, Intersect, and Textfield to create dynamic elements where users can input values and observe how various methods (e.g., standard algorithm, area decomposition, grid method) yield the same product. Suitable for upper elementary to middle school students to deepen understanding of decimal multiplication, and for teachers to illustrate algorithmic diversity in the classroom.
GeoGebra Commands & Parameters
Point(O) → DPolygon(A0, A, A1, D) → q1, a0, a_1, a1, d_1PointIn(q1) → 点q1Polygon(C, J, B, E) → q2, c_1, j, b_1, ePointIn(q2) → 点q2Intersect(a0, d_1) → FPolygon(F, B1, J, C) → q3, f, b1, j_1, c_2PointIn(q3) → 点q3Polygon(B1, A, C1, J) → q4, g, a_2, c1, j_2PointIn(q4) → 点q4Intersect(a_1, a1) → GPolygon(J, C1, G, B) → q5, j_3, h, g_1, b_2PointIn(q5) → 点q5Textfield(b) → InputBox8Textfield(d) → InputBox9Textfield(文本m1) → InputBox10Textfield(文本m2) → InputBox11Textfield(文本q1) → InputBox12
AI Drawing Prompt Reference
Create an interactive geometric model showing the connections between multiple algorithms for multiplying decimals. Use points and polygons to represent the multiplication process, with intersections and dynamic input boxes allowing users to enter values and observe how different methods like the standard algorithm, area decomposition, and grid method yield the same product. The visualization should include several polygons, intersection points, and interactive elements for text input and display, making abstract arithmetic operations tangible.
The prompt above was compiled from the original drawing commands and is for reference only.