
Tangent Planes and Linear Approximations Example
Loading the math board and drawing, please wait…
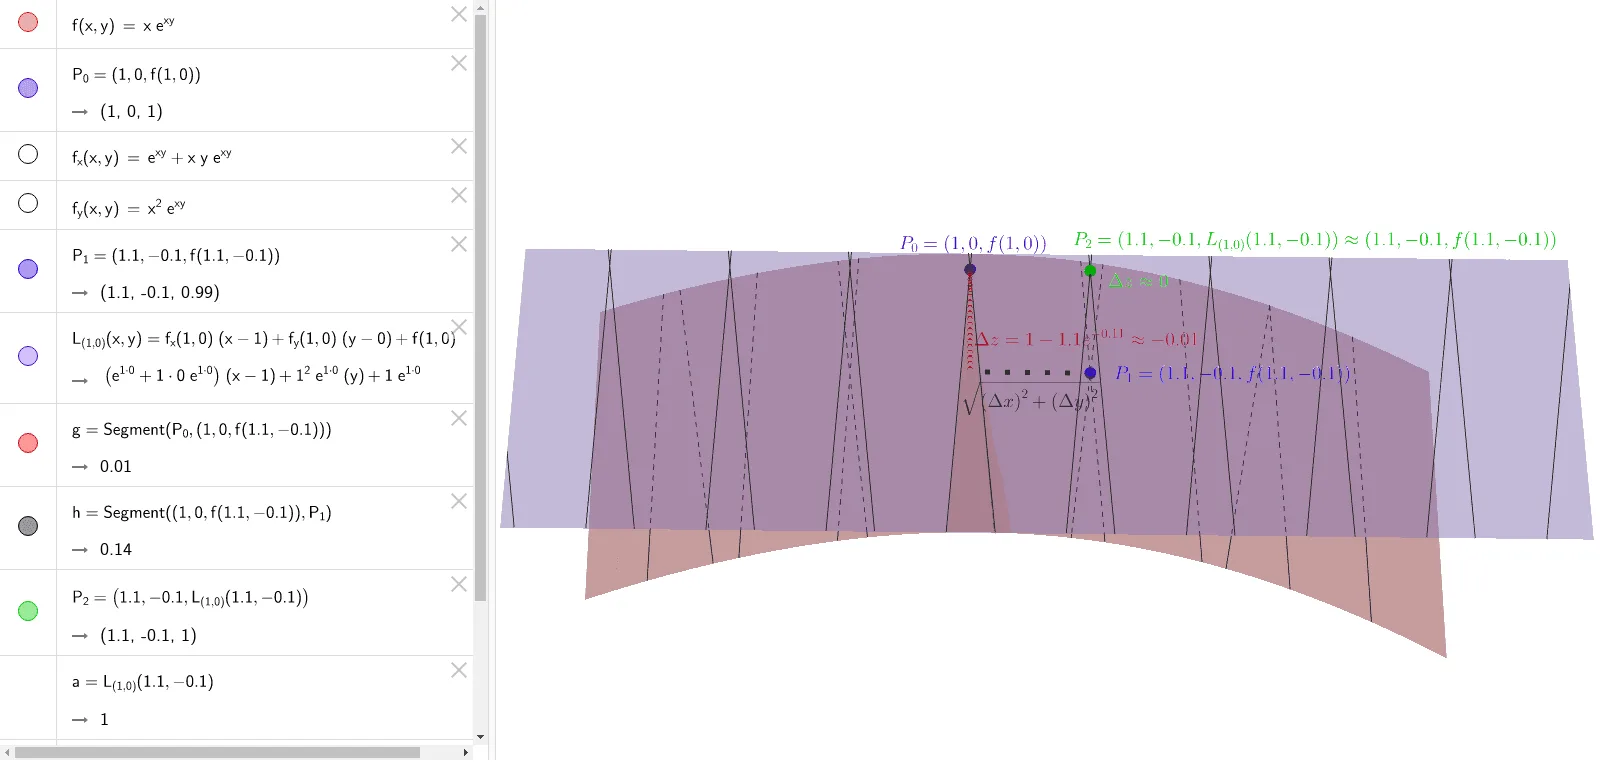
This example demonstrates how to plot tangent planes and linear approximations of a function in 3D space. Key math concepts include tangent plane equations, linear approximation, partial derivatives, and function graphing. GeoGebra commands used are Segment, objects like f (function), P0 (point), fx (partial derivative x), fy (partial derivative y), P1 (point), L(1,0) (line), g, h, P2 (point), a, b, P3 (point). Suitable for university calculus courses to help students understand the geometric meaning and applications of tangent planes and linear approximations.
GeoGebra Commands & Parameters
Segment(P_{0}, (1, 0, f(1.1, -0.1))) → gSegment((1, 0, f(1.1, -0.1)), P_{1}) → h
AI Drawing Prompt Reference
Plot a function in 3D space and label its tangent plane and linear approximation. Start by drawing a line segment from the point of tangency along the x-axis to the function's value at x=1.1, y=-0.1, then draw another segment from this point to a different point to show the local linear approximation of the tangent plane.
The prompt above was compiled from the original drawing commands and is for reference only.