
Tangent Envelope and Derived Function Visualization
Loading the math board and drawing, please wait…
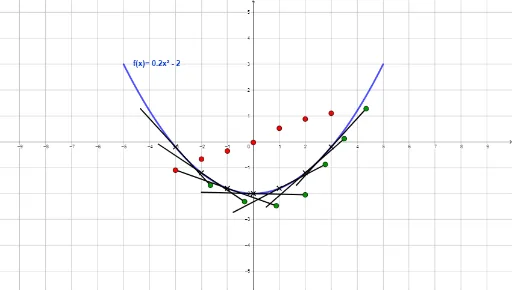
① This example dynamically displays the tangent lines at various points on a function curve, visually demonstrating the relationship between the tangent envelope and the derived function (derivative), where the slope of the tangent as a function of x forms the derivative graph. ② Core mathematical concepts include derivatives, tangent lines, envelopes, function graphs, and the geometric meaning of slope as instantaneous rate of change, central to calculus. ③ Construction highlights: using GeoGebra commands such as Circle, Point, Line, Slope, and Spline to construct the function curve, tangent points, tangent lines, and slope measurements; using Mirror and Segment for auxiliary symmetric or connecting elements; a Textfield allows input of the function expression; multiple points (A, B, C, etc.) and segments (l, m, n, etc.) are linked dynamically to produce a synchronized display of the tangent envelope and the derivative curve. ④ Suitable for high school to early college calculus instruction, helping students understand the definition of the derivative, tangent slope, and rate of change; also useful for classroom demonstrations or self-guided exploration of the geometric meaning of derivatives.
GeoGebra Commands & Parameters
Textfield(f) → ChampTexte1Circle(A, 2) → cCircle(B, 2) → dCircle(C, 2) → eCircle(D, 2) → gCircle(E, 2) → hCircle(F, 2) → kCircle(G, 2) → pPoint(c) → HPoint(d) → IMirror(H, A) → H'Mirror(I, B) → I'Segment(H, H') → iSegment(I, I') → jPoint(e) → JPoint(g) → KPoint(h) → LMirror(J, C) → J'Mirror(K, D) → K'Segment(J, J') → lSegment(K, K') → mMirror(L, E) → L'Segment(L, L') → nPoint(k) → MMirror(M, F) → M'Segment(M, M') → qPoint(p) → NMirror(N, G) → N'Segment(N', N) → rLine(H', H) → sLine(I', I) → tLine(J', J) → aLine(K', K) → bLine(L', L) → f_1Line(M', M) → g_1Line(N', N) → h_1Slope(s) → oSlope(t) → uSlope(a) → vSlope(b) → wSlope(f_1) → a_1Slope(g_1) → b_1Slope(h_1) → c_1Spline(l1, 3) → d_1