
Derivative of ln(x): Visualizing Tangent Slope
Loading the math board and drawing, please wait…
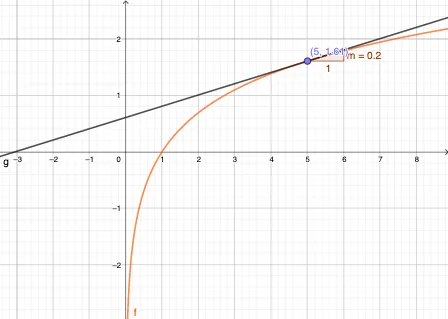
① This GeoGebra example dynamically visualizes the graph of the natural logarithm function y = ln(x), with a movable point A on the curve, its tangent line, and the computed slope, clearly showing how the derivative changes with x. ② The core mathematical concept is the geometric meaning of the derivative: the derivative at a point equals the slope of the tangent line there. For ln(x), the derivative is 1/x, illustrating a fundamental property of logarithmic functions. ③ Construction details: the Point command creates a dynamic point A on the function f; the Tangent command draws the tangent line g at A; the Slope command computes the slope m, linking the numerical derivative to the visual graph. ④ This is suitable for senior high school or introductory college calculus students to understand the definition of the derivative, the derivative formula for logarithmic functions, and to explore rates of change dynamically. It also serves as an effective demonstration tool for teachers.
GeoGebra Commands & Parameters
Point(f) → ATangent(A, f) → gSlope(g) → m
AI Drawing Prompt Reference
Draw the graph of the natural logarithm function y = ln(x). Place a movable point on the curve. At this point, construct the tangent line to the curve and display the numerical value of its slope. As the point moves along the curve, the tangent line and slope value update dynamically, illustrating that the derivative at a point equals the slope of the tangent line. Include coordinate axes, the function curve, the tangent line, and a slope label. Keep the visualization clean and suitable for teaching.
The prompt above was compiled from the original drawing commands and is for reference only.