
Gradient Function of Logarithmic Functions – Dynamic Derivative Visualization
Loading the math board and drawing, please wait…
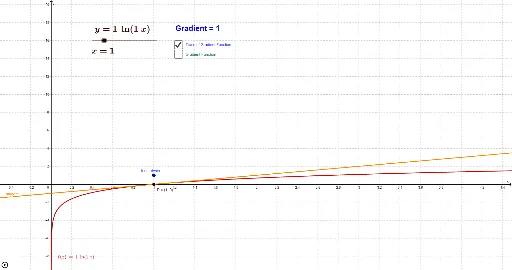
① This GeoGebra example dynamically demonstrates how the slope of the tangent to a logarithmic function changes along the curve, and simultaneously traces the gradient function (derivative) to reveal the relationship between a function and its derivative. ② Core mathematical concepts include the derivative of logarithmic functions, tangent slope, the geometric meaning of the gradient function, and visualization of rates of change. ③ Construction highlights: using GeoGebra commands Point, Tangent, and Slope to create the tangent point, tangent line, and slope measurement; using DerivativeFunction to generate the derivative; using TraceofGradientFunction to trace the gradient curve; objects include function f, tangent, slope m, derivative f', and text displays for equations and x-values. ④ Suitable for high school to early college calculus students, this resource helps build intuitive understanding of logarithmic derivatives and serves as an interactive classroom demonstration or self-study tool.
GeoGebra Commands & Parameters
Point(f) → P_3Point(f) → P_1Point(f) → P_5Point(f) → P_2Point(f) → P_4Tangent(P, f) → tangentSlope(tangent) → m