
Tabular Equation Solving
Loading the math board and drawing, please wait…
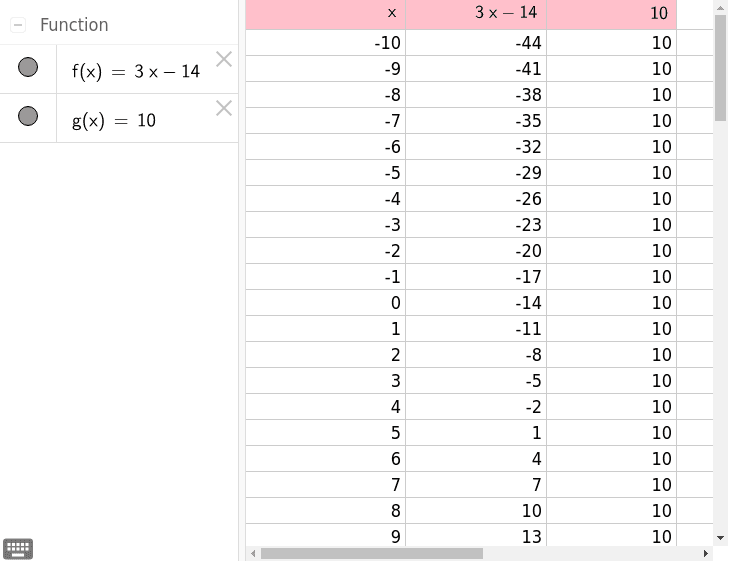
This example demonstrates solving equations through tabular methods, visually correlating function intersections with algebraic solutions. Core math concepts include equation solving, polynomial functions, linear programming, percentages, conic sections, and slope/difference calculations. Construction involves commands like objects A2-A39, particularly functions f, g, and auxiliary points A4-A38 for coordinate plotting. Ideal for high school and above, exploring geometric interpretations and optimization techniques.
GeoGebra Commands & Parameters
Numeric A2(-10.0)A2 + 1f(x) = (3 * x) - 14g(x) = 10(2 * A3) - A2(2 * A4) - A3(2 * A5) - A4(2 * A6) - A5(2 * A7) - A6(2 * A8) - A7(2 * A9) - A8(2 * A10) - A9(2 * A11) - A10(2 * A12) - A11(2 * A13) - A12(2 * A14) - A13(2 * A15) - A14(2 * A16) - A15(2 * A17) - A16(2 * A18) - A17(2 * A19) - A18(2 * A20) - A19(2 * A21) - A20(2 * A22) - A21(2 * A23) - A22(2 * A24) - A23(2 * A25) - A24(2 * A26) - A25(2 * A27) - A26(2 * A28) - A27(2 * A29) - A28(2 * A30) - A29(2 * A31) - A30(2 * A32) - A31(2 * A33) - A32(2 * A34) - A33(2 * A35) - A34(2 * A36) - A35(2 * A37) - A36(2 * A38) - A37(2 * A39) - A38(2 * A40) - A39(2 * A41) - A40(2 * A42) - A41(2 * A43) - A42(2 * A44) - A43(2 * A45) - A44(2 * A46) - A45(2 * A47) - A46(2 * A48) - A47(2 * A49) - A48f(A2)g(A2)f(A3)g(A3)f(A4)g(A4)f(A5)g(A5)f(A6)
AI Drawing Prompt Reference
Plot the graphs of two functions, f as a linear function and g as a horizontal line, to demonstrate the correspondence between function intersections and algebraic solutions via tabular methods. Highlight the function graphs and intersection points in the coordinate system, and show a series of points connected by linear interpolation to visualize the equation-solving process.
The prompt above was compiled from the original drawing commands and is for reference only.