
Systems of Equations on a Graph
Loading the math board and drawing, please wait…
In collections
Test 3 Review Activities
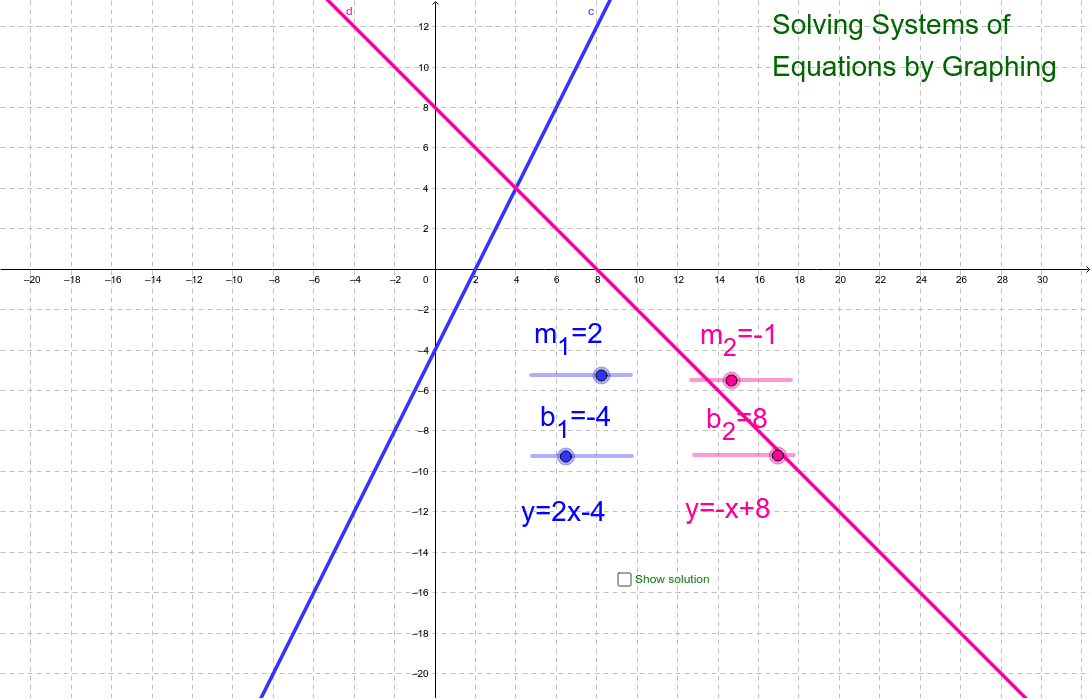
① This interactive example lets students explore systems of linear equations by visualizing two straight lines on a coordinate plane and observing their intersection point. ② Core math concepts include linear equations, slope and intercept, solutions of systems (unique, none, or infinite), and the connection between line intersections and coordinate geometry. ③ Construction details: The GeoGebra commands Intersect and Polygon are used; objects include m_1, b_1, c, m_2, b_2, d representing slopes and intercepts of two lines, point A as the intersection, and auxiliary polygons; multiple text labels (text1 to text6) display equations and results. ④ Suitable for middle school to high school students learning the integration of algebra and geometry, ideal for classroom demonstration or self-exploration—by dragging sliders to change slopes and intercepts, students can see in real time how the solution of the system changes.
GeoGebra Commands & Parameters
Intersect(c, d) → APolygon((x(A), y(A) + 1), (x(A) + 10, y(A) + 1), (x(A) + 10, y(A) - 1), (x(A), y(A) - 1)) → underLabel, b, e, f, g
AI Drawing Prompt Reference
Draw two lines on a coordinate plane with adjustable slopes and intercepts via sliders. Observe their intersection point. Place a rectangle below the intersection point and label the equations of the lines, the coordinates of the intersection, and the type of solution (unique, none, or infinite).
The prompt above was compiled from the original drawing commands and is for reference only.