
System of Equations Example
Loading the math board and drawing, please wait…
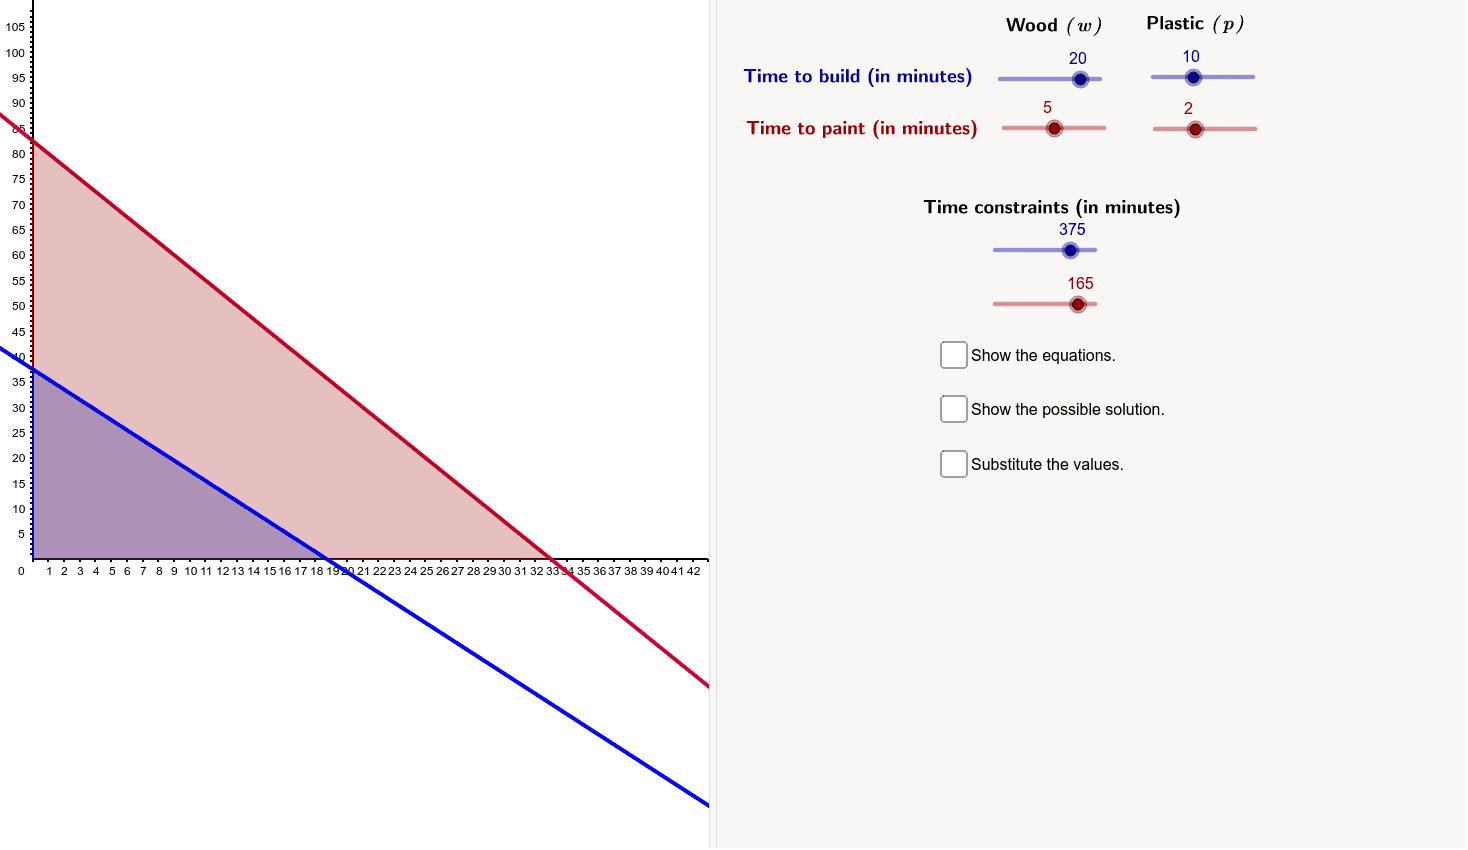
This example demonstrates how to solve a system of equations graphically by finding the intersection points of functions. Key math concepts include inequalities, coordinate geometry, and function graphing. GeoGebra commands used are Intersect, Polygon, and TableText. Suitable for high school students learning about equation solving methods.
GeoGebra Commands & Parameters
Intersect(b, yAxis) → AIntersect(b, xAxis) → BIntersect(xAxis, yAxis) → CPolygon(A, B, C) → poly1, c, a_3, b_3Intersect(a, yAxis) → DIntersect(a, xAxis) → EPolygon(D, E, C) → poly2, c_3, d, eTableText({{((((a_1 * "\mathit{w} +") * b_1) * "\mathit{p} \leq") * c_1)}, {((((a_2 * "\mathit{w} +") * b_2) * "\mathit{p} \leq") * c_2)}, {"\mathit{w} \geq0"}, {"\mathit{p} \geq 0"}}, "{") → text11TableText({{((((((((a_1 * "(") * h) * ")+") * b_1) * "(") * i) * ") \leq") * c_1)}, {((((((((a_2 * "(") * h) * ")+") * b_2) * "(") * i) * ") \leq") * c_2)}, {(h * "\geq0")}, {(i * " \geq 0")}}, "{") → text12TableText({{((I * " \leq") * c_1)}, {((j * "\leq") * c_2)}, {(h * "\geq0")}, {(i * " \geq 0")}}, "{") → text13
AI Drawing Prompt Reference
Draw a coordinate system and plot two lines a and b. Find their intersections with the x-axis and y-axis, and use these points to draw a quadrilateral. Then display the regions for the inequalities a_1w+b_1p≤c_1 and a_2w+b_2p≤c_2, along with w≥0 and p≥0.
The prompt above was compiled from the original drawing commands and is for reference only.