
Symmetry over the y-axis
Loading the math board and drawing, please wait…
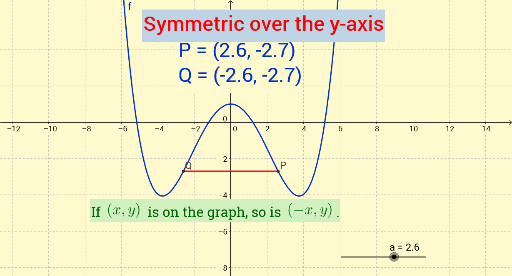
① This GeoGebra example demonstrates the symmetry of a figure (likely a function graph or geometric object) with respect to the y-axis, visually showing the correspondence between original points and their reflected images. ② The core mathematical concept is axial symmetry (reflection about the y-axis), involving coordinate rules (x-coordinate changes sign, y-coordinate remains unchanged) and the congruence between the original and reflected shapes. ③ Construction details: Based on the summary, the example uses the Segment command to draw the axis or connecting segments between corresponding points, and the Text command to label points P, Q and their images, with objects including function f, points a, P, Q, b, and texts textp, textq, text1, text2. It likely allows dragging points or using sliders to observe dynamic symmetry changes. ④ Suitable for middle school to high school students learning symmetry and function graph reflection, as well as for teachers to demonstrate geometric intuition of reflection transformations in coordinate geometry.
GeoGebra Commands & Parameters
Segment(Q, P) → bText("P = " + P) → textpText("Q = " + Q) → textq
AI Drawing Prompt Reference
Draw a figure symmetric about the y-axis, including points P and Q and their y-axis symmetric points P' and Q'. Use segments to connect P and P', Q and Q'. Label the coordinates of points P and Q on the figure.
The prompt above was compiled from the original drawing commands and is for reference only.