
Study Inequalities on Number Line - Adjust Display Position
Loading the math board and drawing, please wait…
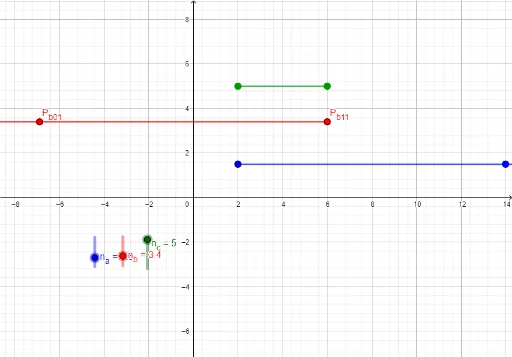
This applet demonstrates how to display inequalities above the x-axis on a number line. Key math concepts include inequalities. The construction uses commands like Simplify, Point, and Locus. Suitable for middle school and above, aiding students in understanding the geometric representation of inequalities.
GeoGebra Commands & Parameters
Simplify(a(x) ∧ b(x)) → cPoint(c, 0) → ALocus(A'', A) → loccPoint(a, 0) → P_{a}Locus(P_{a01}, P_{a}) → locaPoint(b, 0) → P_{b}Locus(P_{b0}, P_{b}) → locb
AI Drawing Prompt Reference
Draw a number line and display two inequalities as colored segments above it, each representing the solution set of one inequality. Add a third segment showing the intersection of both inequalities, positioned higher for clarity. Use sliders to adjust the vertical positions of these segments so they can be compared easily. The segments should extend along the number line according to the inequality ranges, with distinct colors or styles for each.
The prompt above was compiled from the original drawing commands and is for reference only.