
Student Pet Preference Survey Data Analysis
Loading the math board and drawing, please wait…
In collections
CCGPS CA Unit 4 Lesson 2
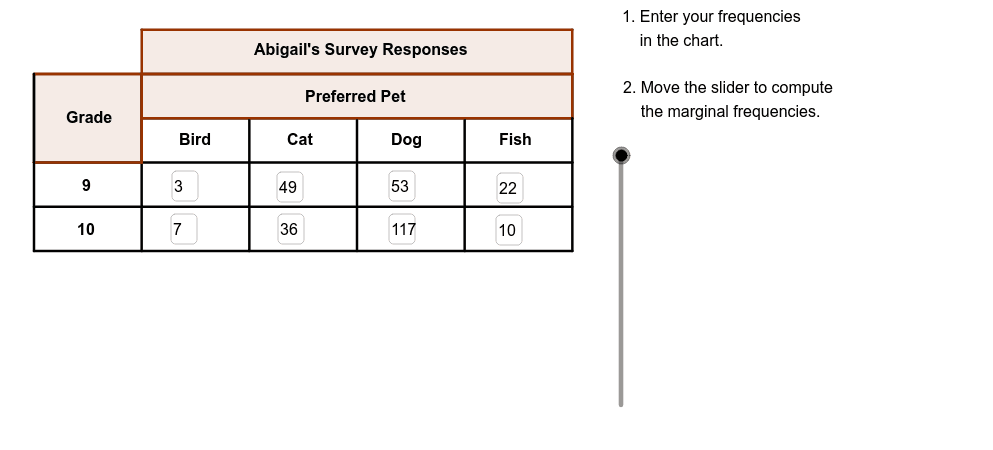
This example demonstrates how to analyze survey data on pet preferences among students in different grades using bar charts. Key math concepts include data statistics, bar chart creation, and probability & statistics. It utilizes GeoGebra commands/objects like Textfield, Segment, Polygon, and Vector as outlined. Suitable for middle school students learning data analysis and charting, or introductory statistics education.
GeoGebra Commands & Parameters
Textfield(B3) → bird9Textfield(B4) → bird10Textfield(C3) → cat9Textfield(C4) → cat10Textfield(D3) → dog9Textfield(D4) → dog10Textfield(E3) → fish9Textfield(E4) → fish10Segment(C, D) → bSegment(E, F) → cSegment(G, H) → dSegment(I, J) → eSegment(A, M) → gSegment(N, K) → hSegment(M, K) → iSegment(O, P) → jSegment(Q, R) → kSegment(S, T) → lSegment(B, L) → mPolygon(C, N, K, M) → poly1, n, p, q, rPolygon(C, U, O, A) → GradePoly, s, t, a_1, b_1Segment(A, S) → aSegment(K, T) → fPolygon(S, B, V, D) → poly2, s_1, b_2, v, d_1Polygon(F, A1, W, H) → poly3, f_1, a1, w, h_1Polygon(Z, L, T, J) → poly4, z, l_1, t_1, j_1Vector(A_1, B_1) → uVector(C_1, D_1) → u_1Vector(E_1, F_1) → v_1Vector(G_1, H_1) → w_1Polygon(I_1, M_1, M, L_1) → Title, c_1, e_1, g_1, i_1
AI Drawing Prompt Reference
Draw a graph with multiple bar charts representing the number of different pet types. Separate the bar charts with lines. Add titles above the bar charts. Include labels below the bar charts showing pet types. Connect the bar charts and labels with lines. The overall graph should be clear and suitable for displaying data.
The prompt above was compiled from the original drawing commands and is for reference only.