
Student Marks Pie Chart
Loading the math board and drawing, please wait…
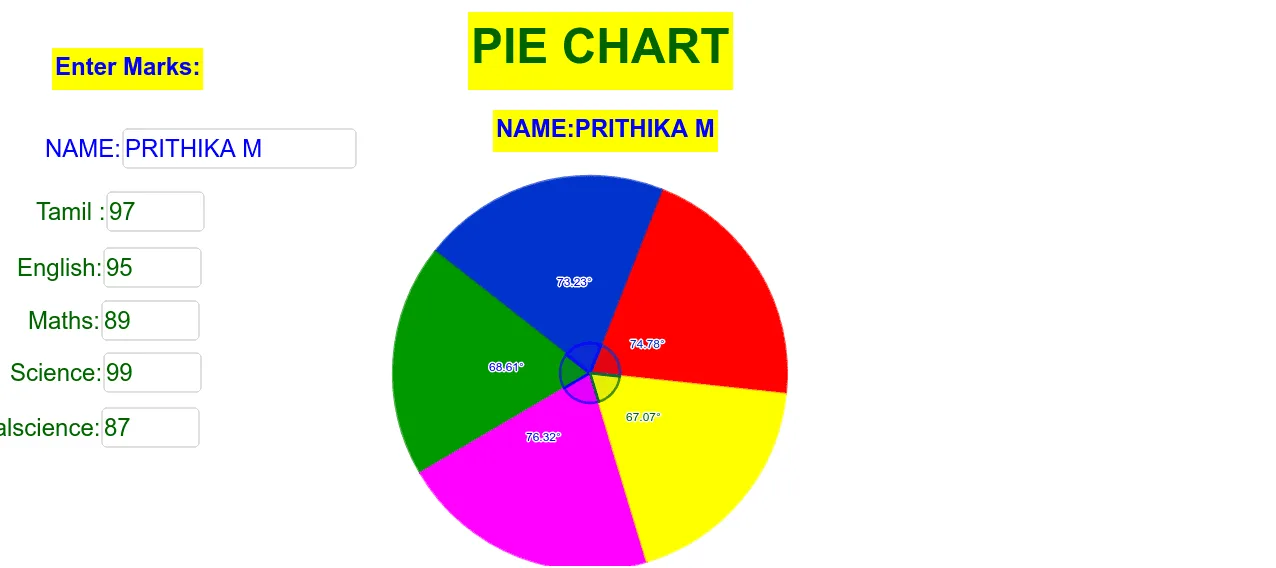
This example demonstrates how to visualize student marks distribution using a pie chart. It involves core math concepts like Probability & Statistics, Fractions, Ratios, and Circles. Construction highlights include using commands such as Sum, Circle, Point, Rotate, Angle, CircleSector, and Textfield with objects like A1, A2, Circle, Point, etc. Ideal for middle school and above learning data visualization and statistical charts.
GeoGebra Commands & Parameters
Sum(B1:B5) → B6Sum(C1:C5) → C6Circle(A, B) → cPoint(c) → CRotate(C, C1°, A) → C'Angle(C, A, C') → αRotate(C', C2°, A) → C''Angle(C', A, C'') → βRotate(C'', C3°, A) → C'''Angle(C'', A, C''') → γRotate(C''', C4°, A) → DAngle(C''', A, D) → δRotate(D, C5°, A) → D'Angle(D, A, D') → εCircleSector(A, C, C') → dCircleSector(A, C', C'') → eCircleSector(A, C'', C''') → fCircleSector(A, C''', D) → gCircleSector(A, D, C) → hTextfield(B1) → InputBox1Textfield(B2) → InputBox2Textfield(B3) → InputBox3Textfield(B4) → InputBox4Textfield(B5) → InputBox5Textfield(B8) → InputBox6
AI Drawing Prompt Reference
Create a pie chart to visualize the distribution of student marks. First, calculate the total scores for each mark range and store them in cells B6, C6, etc. Then, draw a circle c centered at point A and rotate point C to generate C', C'', C''', D, and D'. Use these points to construct angles α, β, γ, δ, and ε. Next, create sector areas d, e, f, g, and h based on these angles. Finally, add input boxes InputBox1 to InputBox6 next to each sector area to display the names of each mark range.
The prompt above was compiled from the original drawing commands and is for reference only.