
Statistics and Geometry Combined Demo
Loading the math board and drawing, please wait…
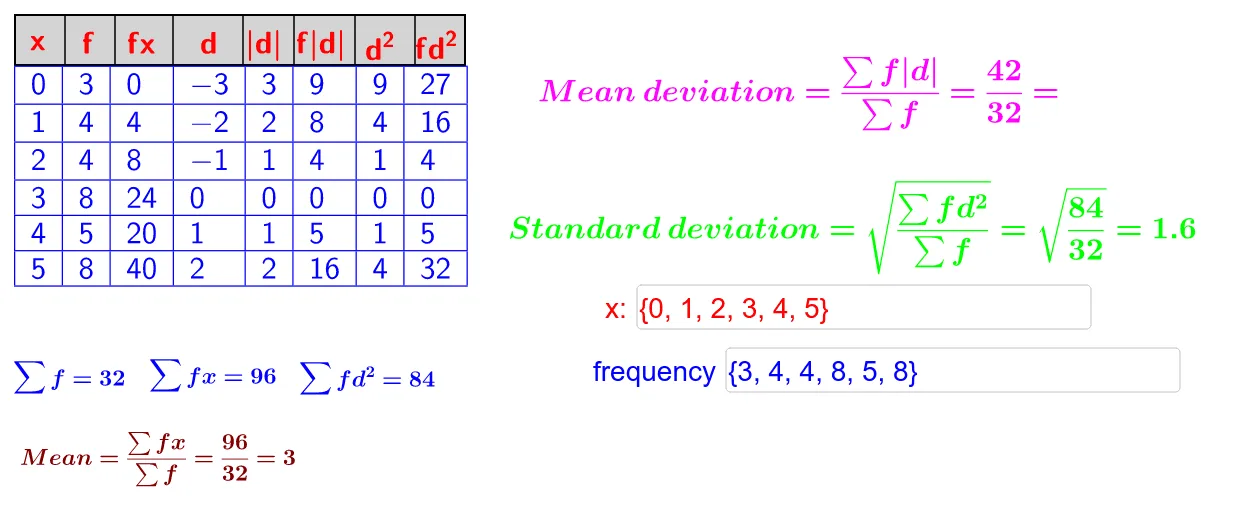
This example demonstrates the integration of statistical data distribution with geometric shapes through interactive graphics; Core math concepts include probability & statistics, polygon construction, coordinate geometry, and sequence summation; GeoGebra commands/objects used are mean, Sequence, Sum, Textfield, TableText, Polygon, Point, Segment; Suitable for high school and above students to understand the comprehensive application of mathematics and visualization.
GeoGebra Commands & Parameters
mean(a_1, a_2) → aSequence(Element[a_1, i] - a, i, 1, Length[a_1]) → a_4Sequence(Element[a_4, i]^(2), i, 1, Length[a_4]) → a_5Sum(a_6) → eSum(a_3) → kSum(a_2) → lTextfield(a_1) → InputBox1Textfield(a_2) → InputBox2TableText(a_1, a_2, a_3, a_4, a_7, a_8, a_5, a_6, "|111111_11111111v") → text1Polygon(E, F, G, H) → q1, e_1, f, g, hPoint(f) → IPoint(h) → JSegment(I, J) → iPoint(h) → LSegment(K, L) → jPoint(f) → MPoint(h) → NSegment(M, N) → pPoint(f) → OPoint(h) → PSegment(O, P) → qPoint(f) → QPoint(h) → RSegment(Q, R) → rPoint(f) → SPoint(h) → TSegment(S, T) → sPoint(f) → UPoint(h) → VSegment(U, V) → tSum(a_7) → bSum(a_8) → c