
Interactive Visualization of Fractions and Percentages
Loading the math board and drawing, please wait…
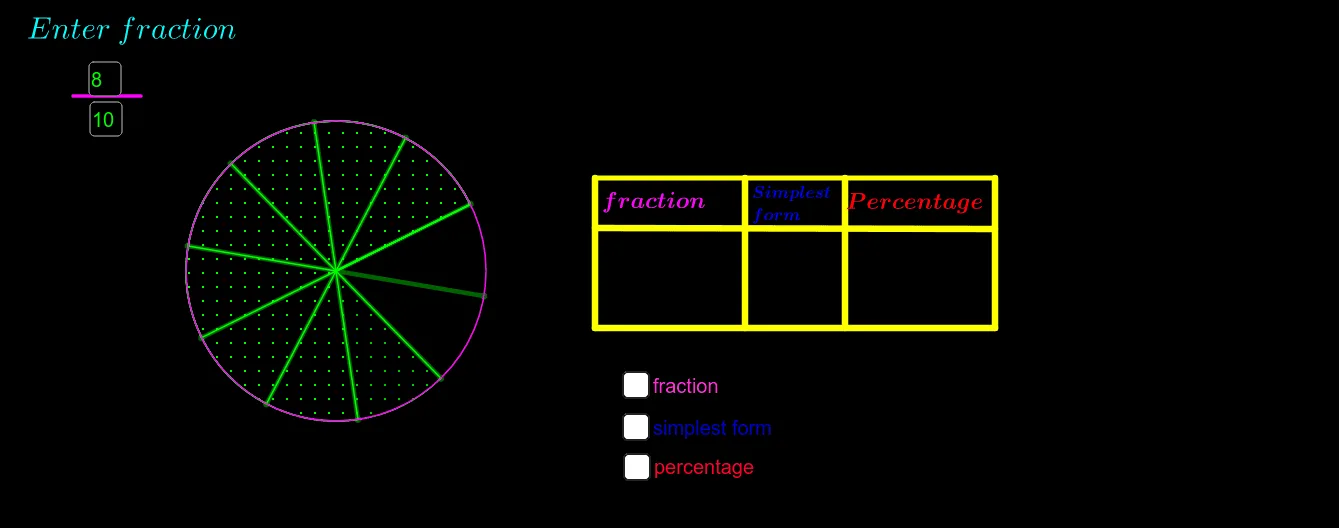
This GeoGebra example dynamically demonstrates the relationship between fractions and percentages using geometric models such as equilateral triangles, circles, and line segments. It covers core mathematical concepts including fraction meaning, percentage representation, conversion between fractions and percentages, equal partitioning, ratios, and basic algebraic operations. The construction uses commands like Circle, Point, Segment, Sequence, Textfield, InputBox2, GCD, and Polygon to create interactive elements, allowing users to input numerators and denominators and see the corresponding percentage and visual shading. It is suitable for upper elementary and middle school students learning fractions and percentages, as well as for teachers demonstrating part-whole relationships and numerical equivalence in a classroom setting.
GeoGebra Commands & Parameters
Circle(A, 3) → cPoint(c) → BSegment(A, B) → fSequence(Rotate[B, i°, A], i, 0, 360, 360 / denominator) → l1Sequence(Segment[A, Element[l1, t]], t, 1, denominator) → l2Sequence(CircleSector[A, B, Element[l1, r + 1]], r, 1, numerator) → l3Textfield(numerator) → numSegment(C, D) → gTextfield(denominator) → InputBox2GCD(numerator, denominator) → aPolygon(E, F, G, H) → q1, e, f_1, g_1, hPoint(h) → IPoint(f_1) → JSegment(I, J) → iPoint(e) → KPoint(g_1) → LSegment(K, L) → jPoint(e) → MPoint(g_1) → NSegment(M, N) → k
AI Drawing Prompt Reference
Create an interactive visualization of fractions and percentages. Start with a circle of radius 3, place a point on the circle, and connect it to the center to form a radius. Divide the circle into equal parts based on the denominator, drawing segments from the center to each division point. Fill the first numerator sectors with color to represent the fraction. Place two input boxes for numerator and denominator. Draw a horizontal line segment, split it into equal parts matching the denominator, and highlight the first numerator parts. Finally, draw a square, divide it into four equal parts with two crossing segments, and highlight one part to show the relationship between fractions and percentages.
The prompt above was compiled from the original drawing commands and is for reference only.