
Statistical Characteristics & Quadratic Proof: Histogram, Variance, and Congruen
Loading the math board and drawing, please wait…
In collections
Mapping Diagrams: From AB to C&DE, Resource
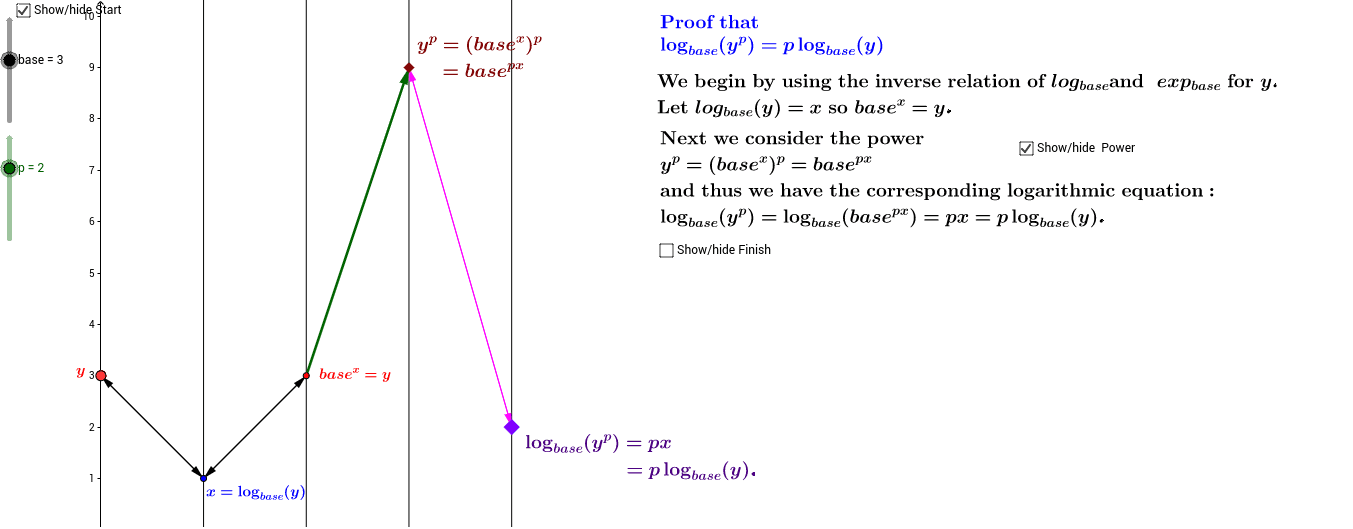
This GeoGebra example demonstrates an interactive proof combining statistical characteristics (histogram, variance) with quadratic equations and congruence. It visualizes how data distribution, variance, and quadratic function properties interrelate through dynamic geometric constructions. Core concepts include histogram representation, variance calculation, quadratic equation graphing, and geometric congruence. The construction uses commands like Point, Textfield, and Vector, along with numerous objects (base, f, a, A_1, A2-A8, B1-B8, C1-C8, D1-D8, etc.) to create an adjustable input box that updates the visualization in real time. Suitable for high school or early college students to explore statistical measures, quadratic functions, and congruence relationships in an integrated, hands-on manner.
GeoGebra Commands & Parameters
Point(yAxis) → A_1Textfield(f) → inputBox1Vector(A_1, B_2) → vVector(B_2, A_2) → wVector(B_2, A_1) → mVector(A_2, B_2) → qVector(A_2, B) → uVector(B, C) → zVector(C, B) → cVector(B_2, C) → e