
Interactive Logarithm, Quadratic & Stochastic Process Demo
Loading the math board and drawing, please wait…
In collections
Mapping Diagrams: From AB to C&DE, Resource
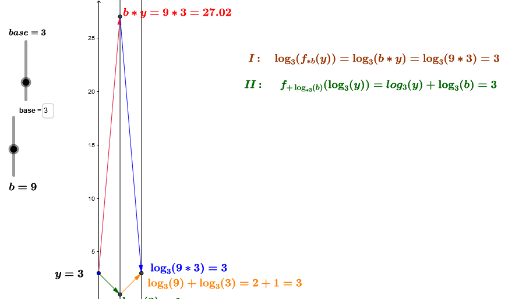
This example demonstrates the interaction between logarithmic functions, quadratic equations, and stochastic processes. It covers core concepts like logarithmic operations, root finding, random variable distribution, and vector representation. Constructed using GeoGebra commands such as Point, Vector, Textfield, and InputBox for dynamic parameter control, with Buttons to trigger calculations. Suitable for high school or university mathematics courses to explore function properties and statistical laws, aiding in understanding complex mathematical models.
GeoGebra Commands & Parameters
Point(yAxis) → AVector(A, B) → uVector(B, C) → vTextfield(f1) → inputBox1Textfield(f2) → inputBox2Vector(C, D) → wTextfield(f3) → inputBox3Textfield(m) → inputBox4_1Vector(A, D) → zVector(A, F) → iVector(F, C) → hVector(C, D) → jVector(B, D) → nVector(D, B) → pPoint(yAxis) → HVector(H, I) → qVector(H, K) → rVector(K, J) → sVector(I, J) → tVector(J, M) → u_1Textfield(base) → inputBox4Vector(I, M) → v_1Vector(M, I) → w_1Vector(H', G') → z_1Vector(H', K') → c_1Vector(K', J') → e_1Vector(G', J') → d_1