
Study Time and Score Relationship: Statistics and Function Fitting
Loading the math board and drawing, please wait…
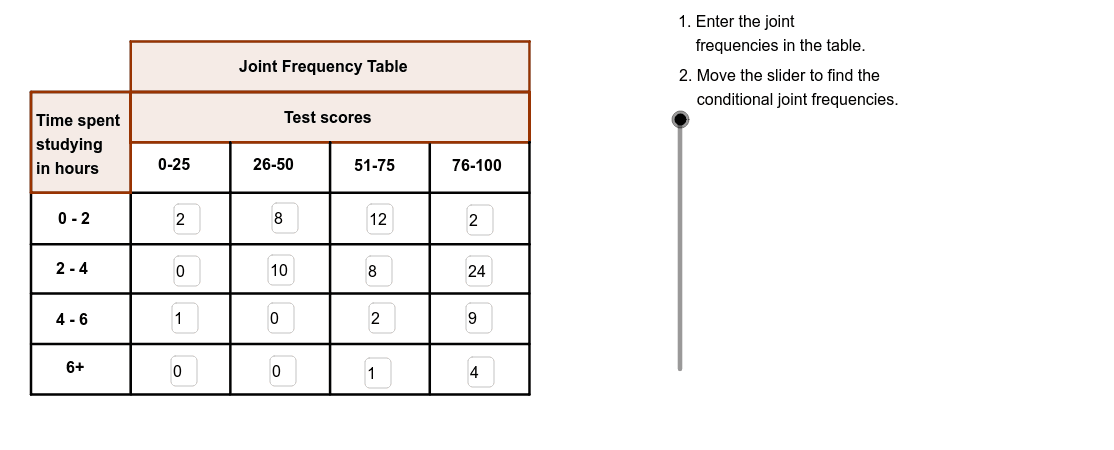
This example demonstrates how a survey of students' study time and scores can be represented as an interactive statistical and functional model. It covers random experiments, sample data, linear regression, power-function fitting, and relationships between variables. The construction summary shows Segment for line segments or axes, Intersect for intersection points, Textfield for editable labels, Polygon for polygonal shapes, and Vector for vector objects; named objects such as A2, B1, E2, and TA4 mark data points, table cells, or text labels. It is suitable for secondary-school statistics and function lessons, as well as GeoGebra practice combining data visualization with geometric construction.
GeoGebra Commands & Parameters
Segment(M, K) → iSegment(A, M) → gIntersect(g, i) → M_1Textfield(B3) → IB3Textfield(B4) → IB4Textfield(C3) → IC3Textfield(C4) → IC4Textfield(D3) → ID3Textfield(D4) → ID4Textfield(E3) → IE3Textfield(E4) → IE4Segment(C, D) → bSegment(I, J) → eSegment(N, K) → hSegment(O, P) → jSegment(Q, R) → kSegment(S, T) → lPolygon(C, N, K, M) → poly1, n, p, q, rPolygon(C, U, O, A) → GradePoly, s, t, a_1, b_1Segment(A, S) → aSegment(K, T) → fVector(A_1, B_1) → uVector(C_1, D_1) → u_1Vector(E_1, F_1) → v_1Vector(G_1, H_1) → w_1Polygon(I_1, Z, M_1, L_1) → Title, d_1, e_1, f_1, g_1Segment(B, F) → cSegment(H, L) → dSegment(E, V) → mSegment(G, W) → c_1Textfield(B5) → IB5Textfield(B6) → IB6Textfield(C5) → IC5Textfield(C6) → IC6Textfield(D5) → ID5Textfield(D6) → ID6Textfield(E5) → IE5Textfield(E6) → IE6
AI Drawing Prompt Reference
Create a statistical graph showing the relationship between students' study time and scores, including line segments and axes, intersection points marked, editable text labels, polygonal shapes for data areas, and vectors/arrows, demonstrating linear regression and power function fitting for educational use in secondary school statistics and functions.
The prompt above was compiled from the original drawing commands and is for reference only.