
Standard Normal Distribution by h.hurchand
Loading the math board and drawing, please wait…
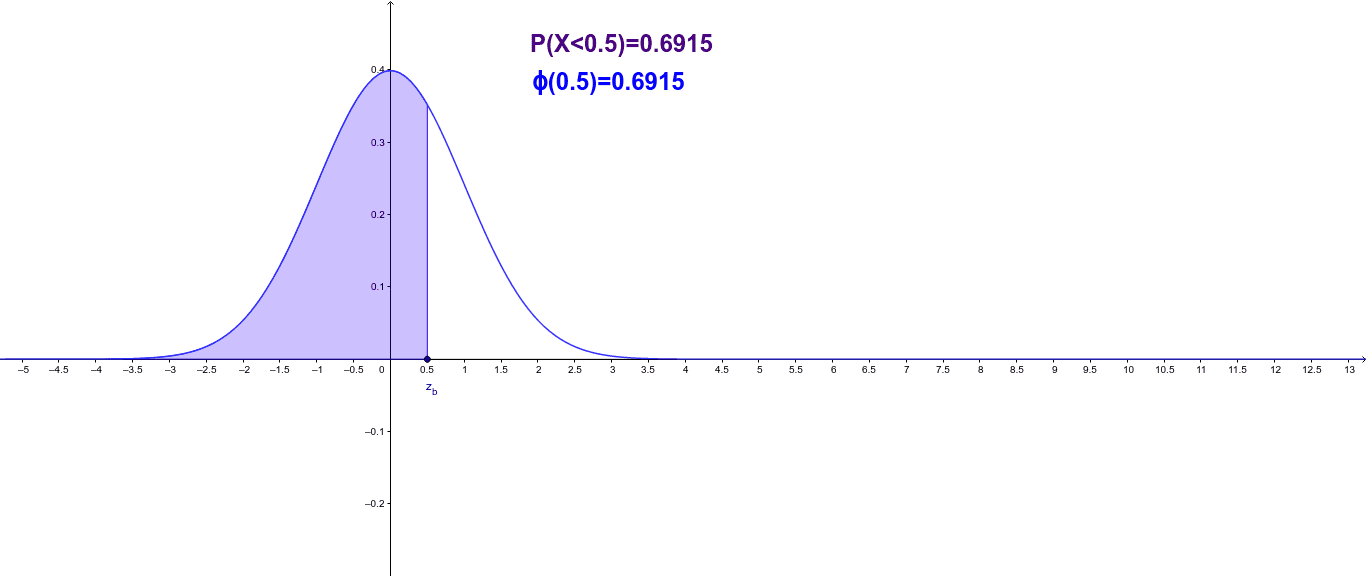
This example demonstrates the standard normal distribution, a special form of the normal distribution with a mean of 0 and a standard deviation of 1. Using the commands from the construction summary, we can see how to draw the standard normal distribution curve and calculate the probability between two specific points using GeoGebra. This example is suitable for high school mathematics education, particularly in probability and statistics courses.
GeoGebra Commands & Parameters
Point(xAxis) → z_aPoint(xAxis) → z_bLine(z_a, z_b) → xaxisIntegral(f, x(z_a), x(z_b)) → PText(((("ϕ(" * x(z_b)) * ")=") * text2)) → text1Text(((("P(X<" * x(z_b)) * ")=") * text2)) → text4
AI Drawing Prompt Reference
Draw the standard normal distribution curve, set two points z_a and z_b on the x-axis, calculate the probability P between z_a and z_b, draw a line segment connecting z_a and z_b on the x-axis, and display the results as ϕ(z_b) and P(X<z_b).
The prompt above was compiled from the original drawing commands and is for reference only.