
Standard Normal Distribution by h.hurchand (2)
Loading the math board and drawing, please wait…
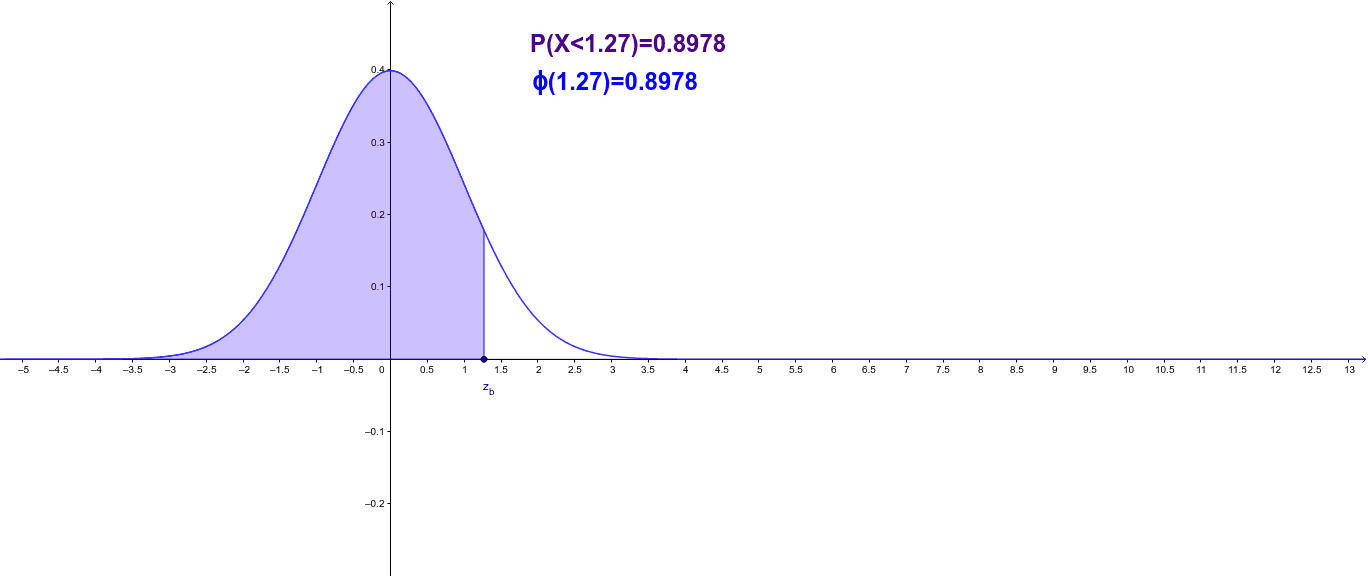
This example demonstrates the probability density function of the standard normal distribution. It involves key concepts in probability and statistics, constructed using GeoGebra commands such as Point, Line, Integral, and Text. Suitable for high school and above students or teachers to understand the properties and applications of the normal distribution.
GeoGebra Commands & Parameters
Point(xAxis) → z_aPoint(xAxis) → z_bLine(z_a, z_b) → xaxisIntegral(f, x(z_a), x(z_b)) → PText(((("ϕ(" * x(z_b)) * ")=") * text2)) → text1Text(((("P(X<" * x(z_b)) * ")=") * text2)) → text4
AI Drawing Prompt Reference
Draw a horizontal axis and mark two points on it, then connect them with a line. Plot the standard normal distribution curve on both sides of the axis, calculate the area under the curve between the two points, and label the area value. Place text above the axis to indicate the function value and probability value, ensuring it corresponds to the graph.
The prompt above was compiled from the original drawing commands and is for reference only.