
Standard Deviation and Distribution Visualization
Loading the math board and drawing, please wait…
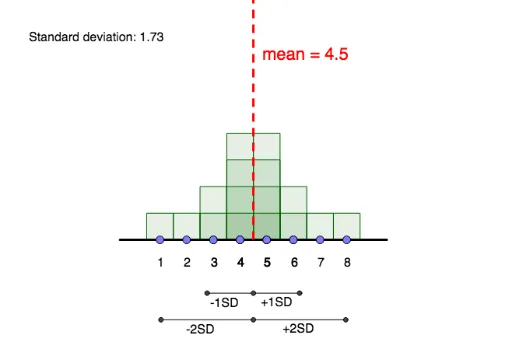
This example demonstrates how manipulating a data set visually impacts its standard deviation and mean. Core concepts include standard deviation, mean, and data distribution. GeoGebra commands and objects used are Segment, Point, Line, Frequency, Mode, Sequence, SD, Intersect, Ray. Suitable for high school mathematics education to understand data statistics and visualization.
GeoGebra Commands & Parameters
Segment((0, 0), (9, 0)) → gPoint(g) → MPoint(g) → QPoint(g) → NPoint(g) → LPoint(g) → KPoint(g) → PPoint(g) → CPoint(g) → DPoint(g) → EPoint(g) → FPoint(g) → GPoint(g) → HPoint(g) → IPoint(g) → JPoint(g) → RPoint(g) → OLine(A, B) → fFrequency(list4, list1) → list5Segment((-0.5, 0), (9.5, 0)) → iMode(list1) → list3Mode(list1) → list6Sequence(Sequence[Polygon[(n - 0.5, 0), (n - 0.5, k), (n + 0.5, k), (n + 0.5, 0)], k, 1, Element[list5, n + 1], 1], n, 0, 9, 1) → list2SD(list1) → bPoint(h) → SIntersect(h, i) → TPoint(h) → ULine(V, W) → pIntersect(l, p) → A_1Intersect(j, p) → B_1Intersect(h, p) → D_1Segment(D_1, B_1) → qSegment(D_1, A_1) → rIntersect(m, s) → ZIntersect(h, s) → C_1Intersect(k, s) → E_1Segment(C_1, Z) → tSegment(C_1, E_1) → aRay(T, U) → n
AI Drawing Prompt Reference
Place 10 points sequentially on a horizontal line, draw rectangles connecting each point to the horizontal line vertically, adjust the heights of the rectangles based on frequency data to show data distribution. Calculate the standard deviation of the dataset, mark the mean and standard deviation on the horizontal line, and draw auxiliary line segments and rays to assist in the visualization.
The prompt above was compiled from the original drawing commands and is for reference only.