
Square Roots 1-50 Visualization
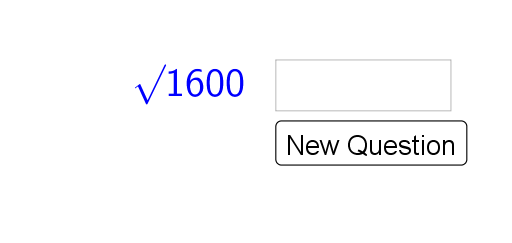
Loading the math board and drawing, please wait…
This example demonstrates the square roots of integers from 1 to 50 using a scatter plot, covering core math concepts like square roots, coordinate systems, function graphs, and complex numbers. It constructs the visualization using GeoGebra commands and objects such as Textfield, Random, answer, blanc, Answer, r, button1, correct_answer, text2, text3, text1_2, making it suitable for middle school and above mathematics education to intuitively understand the properties of square roots and complex numbers.
GeoGebra Commands & Parameters
Textfield(blanc) → AnswerRandom(1, 50) → r