
Spherical Coordinates: Interactive 3D Visualization of Coordinate Transformation
Loading the math board and drawing, please wait…
In collections
Multivariable Calculus
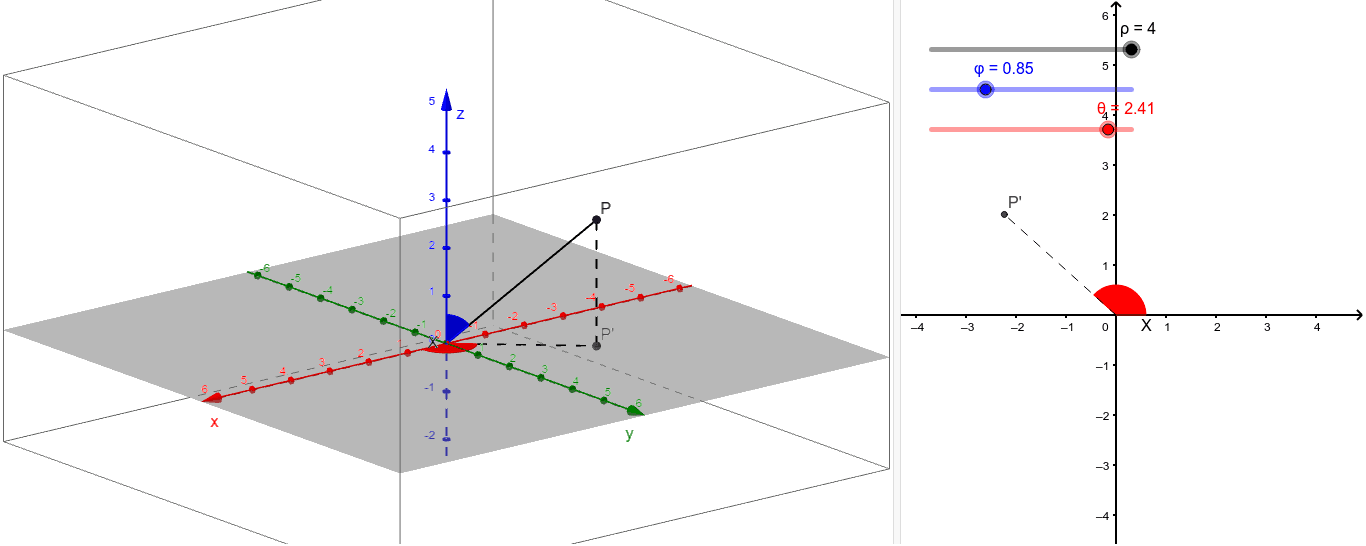
① This GeoGebra example dynamically illustrates a point P in 3D space using spherical coordinates, clearly showing the relationship between Cartesian (x,y,z) and spherical (ρ,φ,θ) representations. ② Core mathematical concepts include the spherical coordinate system, radial distance ρ, polar angle φ (angle from z-axis), azimuthal angle θ (projection in xy-plane), and the coordinate transformation formulas. ③ Construction details: uses Segment command to draw coordinate axes and auxiliary lines, Angle command to mark angles; objects include point P, its projection P', auxiliary lines L, Lperp, Lpara, and variables ρ, φ, θ, α, β, which can be adjusted via sliders or input to update the point's position in real time. ④ Suitable for upper high school or early university students learning multivariable calculus, vector analysis, or physics problems with spherical symmetry; also valuable for teachers demonstrating 3D coordinate transformations in class to enhance spatial reasoning.
GeoGebra Commands & Parameters
Segment((0, 0, 0), P) → LSegment((0, 0, 0), (0, 0, 1)) → ZAngle(Z, L) → αSegment((0, 0, 0), (1, 0, 0)) → XSegment(P, P') → LperpSegment((0, 0, 0), P') → LparaAngle(X, Lpara) → β
AI Drawing Prompt Reference
Create a 3D visualization of spherical coordinate system. Draw x-axis, y-axis, and z-axis originating from the origin in a Cartesian coordinate system. Define an adjustable point P in 3D space. Draw a line segment from the origin to P representing the radial distance. Drop a perpendicular from P to the xy-plane to create its projection point, then draw another segment from the origin to this projection. Mark the angle φ between the z-axis and the line connecting the origin to P (polar angle), and mark the angle θ between the x-axis and the line from the origin to the projection point (azimuthal angle). Clearly display all segments and angles to illustrate the relationship between Cartesian and spherical coordinates, suitable for teaching multivariable calculus or vector analysis.
The prompt above was compiled from the original drawing commands and is for reference only.