
Solving Quadratic Inequalities with Graphs
Loading the math board and drawing, please wait…
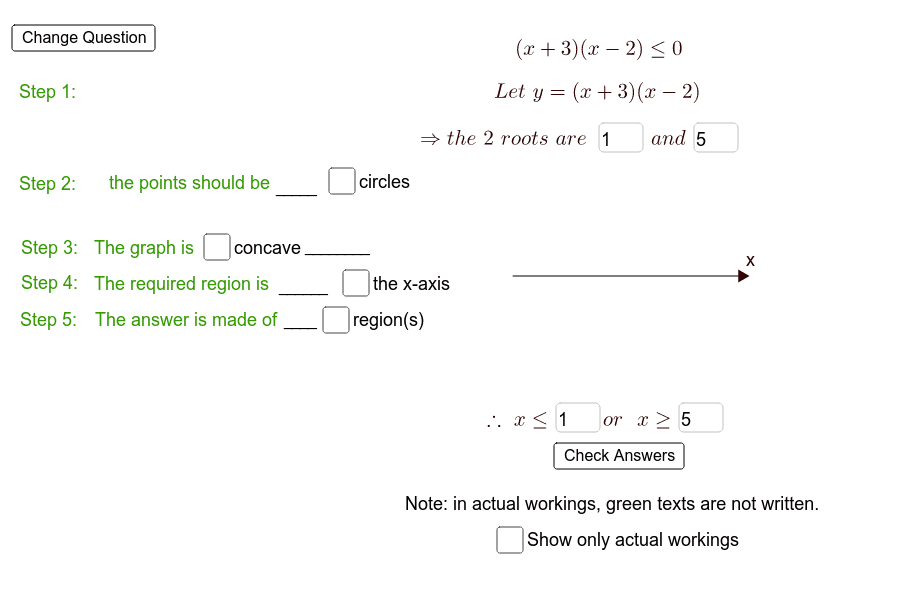
This example demonstrates solving quadratic inequalities by graphing. It involves core math concepts like quadratic functions, their graphs, and solution sets. Constructed using GeoGebra commands like Random, If, Segment, Point, and Textfield to create function graphs and inequality regions. Ideal for high school students and teachers for learning and practice.
GeoGebra Commands & Parameters
Random(1, 5) → qqIf(Random[1, 4] < 4, "+", "-") → asignIf(p + qq ≟ 0, Random[1, 5], p + qq) → qRandom(1, 5) → rRandom(0, 1) → ineqRandom(0, 1) → eqIf(ineq ≟ 0, If[eq ≟ 0, "<", "≤"], If[eq ≟ 0, ">", "≥"]) → eqtextSegment(E, F) → cPoint(c) → APoint(c) → BTextfield(pz) → InputBox1Textfield(qz) → InputBox2If(eq ≟ 0, "<", "≤") → regeqIf(eq ≟ 0, ">", "≥") → regeq2Textfield(answ1) → InputBox3Textfield(answ2) → InputBox4If(pz ≟ p ∧ qz ≟ q ∨ pz ≟ q ∧ qz ≟ p, "✔", "X") → chk1If(eq ≟ 0 ∧ e ≟ false ∨ eq ≟ 1 ∧ e ≟ true, "✔", "X") → chk2If(asign ≟ "+" ∧ a ≟ true ∨ asign ≟ "-" ∧ a ≟ false, "✔", "X") → chk3If(ineq ≟ 1 ∧ b ≟ true ∨ ineq ≟ 0 ∧ b ≟ false, "✔", "X") → chk4If(asign ≟ "+" ∧ ineq ≟ 1 ∧ d ≟ false ∨ asign ≟ "+" ∧ ineq ≟ 0 ∧ d ≟ true ∨ asign ≟ "-" ∧ ineq ≟ 1 ∧ d ≟ true ∨ asign ≟ "-" ∧ ineq ≟ 0 ∧ d ≟ false, "✔", "X") → chk5If(answ1 ≟ p ∧ answ2 ≟ q, "✔", "X") → chk6