
Seeing the 1st and 2nd derivative from the graph of f
Loading the math board and drawing, please wait…
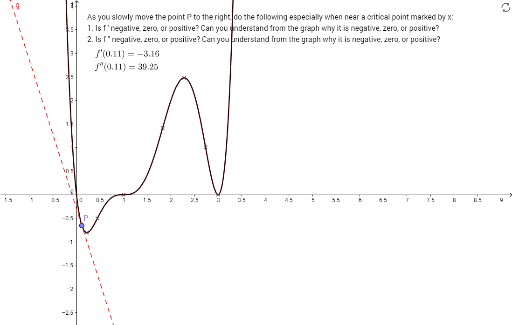
This GeoGebra example dynamically displays the graph of a function f along with its first derivative f' and second derivative f'', allowing learners to visually connect the behavior of the function to its derivatives. It demonstrates how the sign of f' indicates increasing/decreasing intervals, how the sign of f'' indicates concavity (convex/concave), and where inflection points occur (f''=0). The construction uses GeoGebra commands such as Point to place a movable point P on the curve, Tangent to draw the tangent line at P, Derivative to generate f' and f'', Intersect to find key intersection points, and OrthogonalLine to create perpendicular reference lines. Text objects label important values. This resource is ideal for high school or introductory college calculus students, supporting classroom demonstrations or self-paced exploration of derivative concepts.
GeoGebra Commands & Parameters
Point(f) → PTangent(P, f) → gDerivative(f) → f'Derivative(f') → f''Intersect(f', xAxis) → A, C, D, EIntersect(f'', xAxis) → F, G, H, IOrthogonalLine(A, xAxis) → hOrthogonalLine(F, xAxis) → iOrthogonalLine(C, xAxis) → jOrthogonalLine(H, xAxis) → kOrthogonalLine(D, xAxis) → lOrthogonalLine(I, xAxis) → mOrthogonalLine(E, xAxis) → nIntersect(f, h) → BIntersect(f, i) → JIntersect(f, j, 1) → KIntersect(f, k) → LIntersect(f, l) → MIntersect(f, m) → N