
Solving a Pair of Linear Equations in Two Variables
Loading the math board and drawing, please wait…
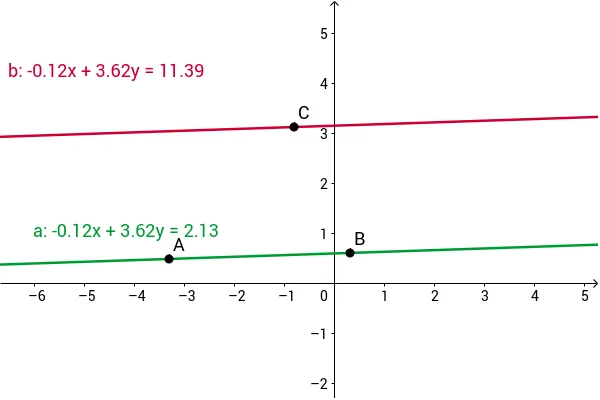
This example shows how to solve a system of two linear equations in two variables by graphing the corresponding lines and locating their unique intersection point. The core mathematical ideas include the representation of linear functions as straight lines, the relationship between slope and intercept, the conditions for existence and uniqueness of solutions, and the geometric interpretation of solving equations via coordinate geometry. In GeoGebra the construction uses the Line command, defining points A, B and parameters a, C, b to draw the two lines; sliders allow users to vary the coefficients and see how the lines move and intersect. The activity is intended for high‑school students studying algebra and analytic geometry, as well as for first‑year university students encountering linear systems in mathematics analysis, providing a visual bridge between algebraic manipulation and geometric insight.
GeoGebra Commands & Parameters
Line(A, B) → aLine(C, a) → b
AI Drawing Prompt Reference
Draw two lines determined by two points, where the slopes and intercepts of the lines can be adjusted using sliders. Observe how the lines move and intersect as the coefficients change, finding their unique intersection point. This visualizes solving a system of linear equations by graphing, showing the representation of linear functions as straight lines, the relationship between slope and intercept, and the conditions for the existence and uniqueness of solutions.
The prompt above was compiled from the original drawing commands and is for reference only.