
Solve and Graph Quadratic Inequality
Loading the math board and drawing, please wait…
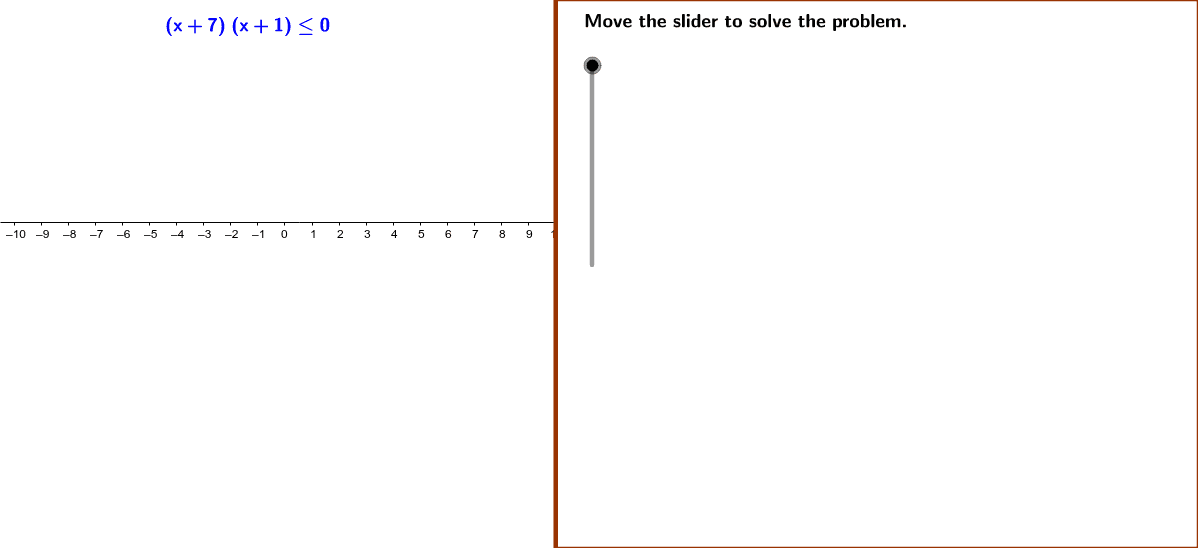
This example demonstrates solving the quadratic inequality x² + 8x + 7 ≤ 0 and graphing the solutions on a number line. Key math concepts include quadratic inequality solving, number line representation, and interval notation. GeoGebra commands and objects used in construction are Polygon, Simplify, If, Segment, with objects like root2, root1, h, edge, Mask, etc. Suitable for middle school and above students to understand the connection between algebraic solutions and geometric visualization.
GeoGebra Commands & Parameters
Polygon((edge, y(Corner[1])), Corner[2], Corner[3], (edge, y(Corner[4]))) → Mask, mask1, mask2, mask4, mask3Simplify(Expression0) → Expression1If(root1 < (-9), root1 - 1, -10) → test1If(root2 > -1, root2 + 1, 0) → test3If(root2 < -1, root2 - 1, If[root1 > (-3), root1 + 1, -2]) → test2Segment(P1, P2) → solSimplify(((x - root1) * (x - root2))) → f
AI Drawing Prompt Reference
Draw a number line and mark the solution set of the inequality x² + 8x + 7 ≤ 0. First, find the two roots of the inequality, then plot the corresponding intervals on the number line with solid dots to indicate the inclusion of endpoints. Finally, connect the intervals on the number line with a line segment to create a clear geometric representation.
The prompt above was compiled from the original drawing commands and is for reference only.