
Slope of the Tangent Line to the Sine Curve
Loading the math board and drawing, please wait…
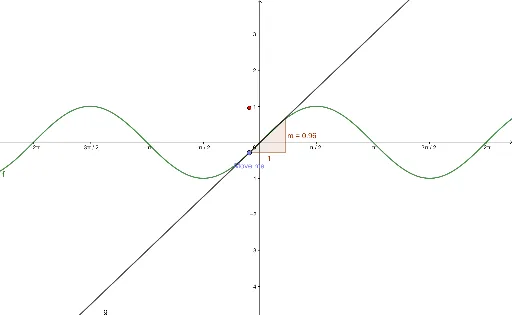
This interactive GeoGebra applet dynamically traces the slope of the tangent line at a moving point on the sine curve, visually demonstrating the geometric meaning of the derivative as the slope of the tangent. It focuses on the core concepts of calculus and differential calculus, particularly the derivative of trigonometric functions)Skip. The construction uses GeoGebra commands: Point to create a movable point A on the sine function f, Tangent to generate the tangent line g at A, and Slope to compute its slope m. A point P is then defined with x-coordinate equal to A's x-coordinate and y-coordinate equal to m, and its locus is traced to reveal the derivative curve. This applet is ideal for high school or introductory college calculus students to explore the relationship between a function and its derivative, and to verify that the derivative of sin(x) is cos(x) through visual experimentation.
GeoGebra Commands & Parameters
Point(f) → ATangent(A, f) → gSlope(g) → m
AI Drawing Prompt Reference
Draw a sine curve and place a movable point on it. At this point, construct the tangent line to the curve and display its slope. Then define another point whose x-coordinate matches the tangent point's x-coordinate and whose y-coordinate equals the tangent slope. As the tangent point moves along the sine curve, trace the path of this new point, revealing a curve that visually represents the derivative of the sine function.
The prompt above was compiled from the original drawing commands and is for reference only.