
Slope of a Line by Run and Rise
Loading the math board and drawing, please wait…
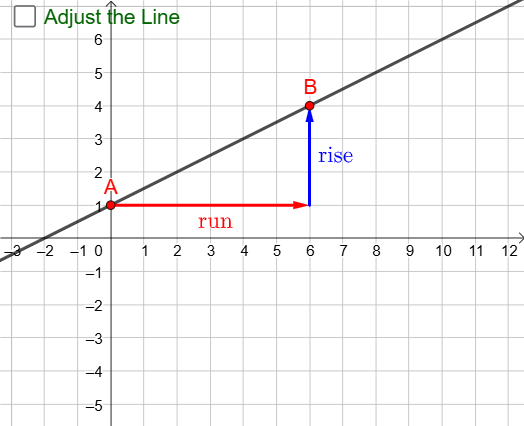
This GeoGebra example demonstrates how the slope of a straight line can be interpreted as the ratio of rise to run, using two points on the line. It connects the line’s inclination to coordinate differences (Δy over Δx) and emphasizes the geometric meaning of “change rate.” The construction starts by creating a Line and Points on the coordinate plane, then uses a Vector to represent the displacement from one point to another. With If, Sequence, and a condition-driven setup, it computes run and rise values and updates answers accordingly; IntegerPoints supports iterating over discrete candidate points to compare slopes produced by different step choices. The scene includes labeled quantities such as run, rise, δ (delta), and step-by-step display objects (step1/step2, showstep2, ans) that present the reasoning process and final ratio clearly. Suitable for middle/high school instruction on functions, analytic geometry basics, and for learners who need a visual method to compute and interpret slope.
GeoGebra Commands & Parameters
Line(D, E) → gPoint(g) → BPoint(g) → ALine(A, B) → fSequence(Vector[A + (sgn(x(B) - x(A)) * (i, 0)), A + (sgn(x(B) - x(A)) * (i + 1, 0))], i, 0, abs(x(B) - x(A)) - 1) → l1Sequence(Vector[(x(B), y(A)) + (sgn(y(B) - y(A)) * (0, i)), (x(B), y(A)) + (sgn(y(B) - y(A)) * (0, i + 1))], i, 0, abs(y(B) - y(A)) - 1) → l2If(step1 ∧ b ∧ (GCD[run, rise] ≠ 1 ∨ run < 0 ∨ rise < 0) ∧ IntegerPoints, true, false) → showstep2Vector(A, (x(B), y(A))) → uVector((x(B), y(A)), B) → v
AI Drawing Prompt Reference
Draw a straight line on a coordinate plane, and place two points on it, connecting them with a segment. From the first point, draw a series of equal horizontal small segments toward the second point's x-coordinate, representing the run. From the second point's vertical level, draw a series of equal vertical small segments toward the first point's y-coordinate, representing the rise. Use arrow vectors to show the horizontal and vertical components from the first point to the second point, and label their lengths. Display labels for 'run' and 'rise' and their ratio (the slope). When certain conditions are met, show an additional step explaining how to compare slopes using integer points. The overall figure should clearly illustrate that slope equals rise divided by run.
The prompt above was compiled from the original drawing commands and is for reference only.