
Slope from Rise and Run
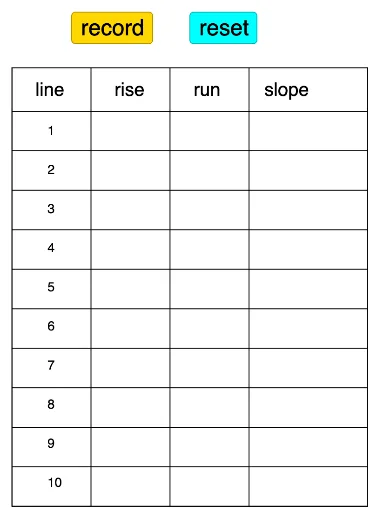
Loading the math board and drawing, please wait…
This example demonstrates how to calculate the slope of a line by using rise and run. It involves core math concepts like slope, linear equations, and coordinate geometry. The construction uses GeoGebra commands/objects such as Element, Length, Intersect, Segment, Sequence, and Line. Suitable for middle school students and above to learn about linear equations and slope calculation, or for teaching demonstrations.
GeoGebra Commands & Parameters
Element(recordrise, 1) → u_1Element(recordrun, 1) → w_1Element(recordrise, 2) → u_2Element(recordrun, 2) → w_2Element(recordrise, 10) → u_{10}Element(recordrise, 8) → u_8Element(recordrise, 6) → u_6Element(recordrise, 5) → u_5Element(recordrise, 4) → u_4Element(recordrise, 3) → u_3Element(recordrise, 7) → u_7Element(recordrise, 9) → u_9Element(recordrun, 10) → w_{10}Element(recordrun, 8) → w_8Element(recordrun, 6) → w_6Element(recordrun, 5) → w_5Element(recordrun, 4) → w_4Element(recordrun, 3) → w_3Element(recordrun, 7) → w_7Element(recordrun, 9) → w_9Length(recordrise) → sIntersect(xAxis, yAxis) → CSegment(F, C) → fSegment(E, J) → jSegment(C, E) → kSegment(F, J) → lSequence(Segment[C + (0, i), E + (0, i)], i, 0, 10) → list1Line(A, B) → mSequence(Segment[C + ((2 * i), 0), F + ((2 * i), 0)], i, 0, 3) → l1
AI Drawing Prompt Reference
Draw a coordinate system with x and y axes intersecting at the origin. Create multiple horizontal and vertical line segments to represent different rise and run values, and connect these points with line segments to illustrate how to calculate the slope of a line using rise and run.
The prompt above was compiled from the original drawing commands and is for reference only.