
Slope Formula Demo
Loading the math board and drawing, please wait…
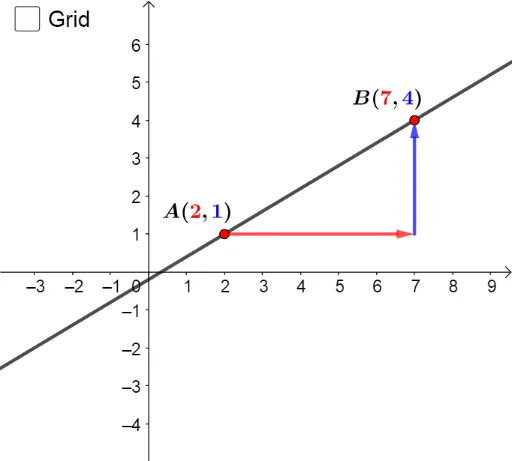
This example dynamically demonstrates the calculation of the slope between two points on a line, visually showing the relationship between slope and the coordinates of points on a linear function. Core math concepts include coordinate geometry, linear functions, and vector operations. Construction highlights involve GeoGebra commands like Line, Sequence, Vector, and If, along with objects such as text and sliders to dynamically display calculation steps. Suitable for middle school and above students learning coordinate geometry and the application of slope formulas.
GeoGebra Commands & Parameters
Line(A, B) → fSequence(Vector[A + (sgn(x(B) - x(A)) * (i, 0)), A + (sgn(x(B) - x(A)) * (i + 1, 0))], i, 0, abs(x(B) - x(A)) - 1) → l1Sequence(Vector[(x(B), y(A)) + (sgn(y(B) - y(A)) * (0, i)), (x(B), y(A)) + (sgn(y(B) - y(A)) * (0, i + 1))], i, 0, abs(y(B) - y(A)) - 1) → l2Vector(A, C) → uVector(C, B) → vIf(step1 ∧ b, true, false) → showstep2If(step2 ∧ b ∧ (GCD[run, rise] ≠ 1 ∨ run < 0 ∨ rise < 0), true, false) → showstep3
AI Drawing Prompt Reference
Draw a line with two points, represent the vector from the start point to the end point with arrows, and draw auxiliary line segments parallel to the x-axis and y-axis. Display the two vectors and calculate and show the slope formula and steps based on the coordinates of the points.
The prompt above was compiled from the original drawing commands and is for reference only.