
Slope Field Template
Loading the math board and drawing, please wait…
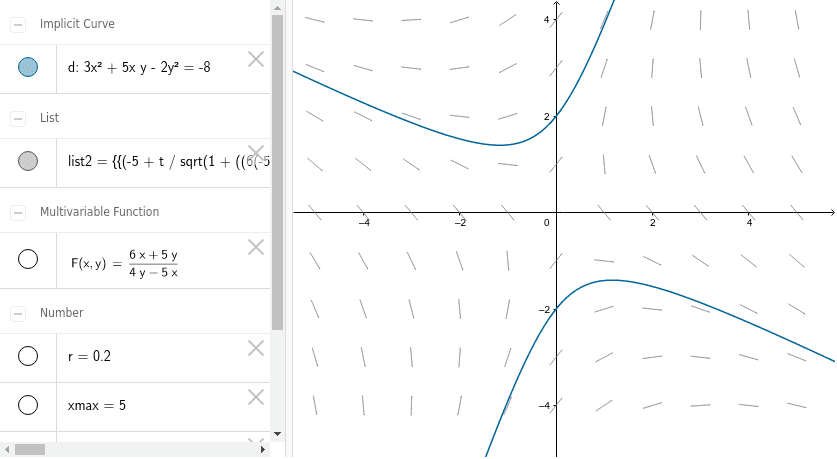
This example demonstrates the slope field for the differential equation dy/dx = F(x, y). It involves core math concepts like differential equations, function graphs, and geometric representation. The construction uses GeoGebra commands ImplicitCurve and Sequence, along with objects r, F, d, xmin, xmax, ymin, ymax, list2. Suitable for high school and above students to learn and understand the geometric meaning of differential equations, ideal for teaching demonstrations and function analysis.
GeoGebra Commands & Parameters
ImplicitCurve((3 * x^(2)) + ((5 * x) * y) - (2 * y^(2)) + 8) → dSequence(Sequence[CurveCartesian[m + t / sqrt(1 + F(m, n)^(2)), n + (t * F(m, n) / sqrt(1 + F(m, n)^(2))), t, (-r), r], m, xmin, xmax], n, ymin, ymax) → list2
AI Drawing Prompt Reference
Draw a slope field for the differential equation dy/dx = 3x^2 + 5xy - 2y^2 + 8, showing small line segments representing slopes at each point within the specified range from xmin to xmax and ymin to ymax. First, plot the equation curve, then add the slope segments at each point within the grid.
The prompt above was compiled from the original drawing commands and is for reference only.