
Slope Field Plotter by Dr Adrian Jannetta
Loading the math board and drawing, please wait…
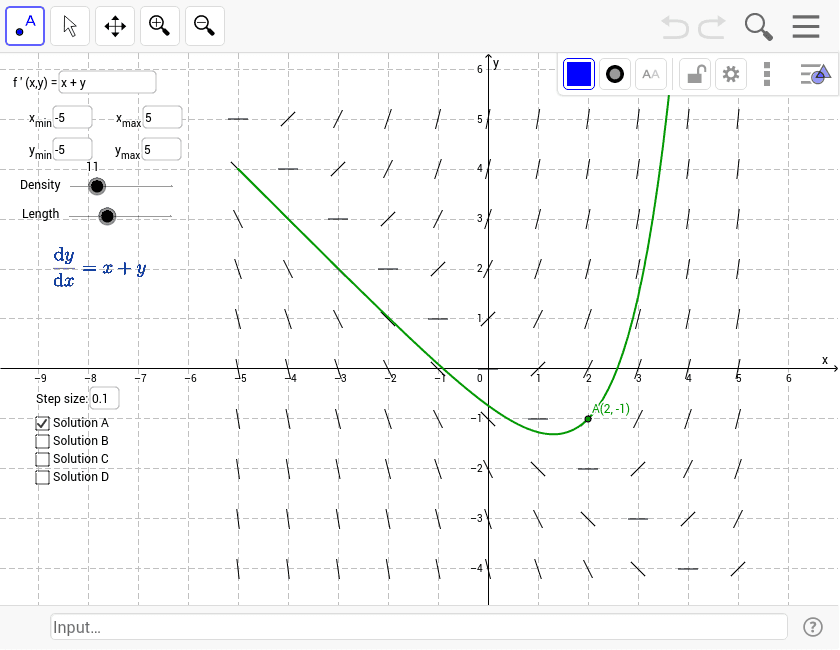
This example plots a direction field for a specified differential equation and displays particular solutions. It demonstrates the concept of direction fields and differential equations. Commands used include Textfield, SlopeField, SolveODE, etc. Suitable for calculus courses.
GeoGebra Commands & Parameters
Textfield(f) → inputBox1Textfield(x_{min}) → inputBox2Textfield(x_{max}) → inputBox3Textfield(y_{min}) → inputBox4Textfield(y_{max}) → inputBox5SlopeField(f, n, L, x_{min}, y_{min}, x_{max}, y_{max}) → slopefield1Textfield(delta) → inputBox6SolveODE(f, x(A), y(A), x_{max}, delta) → numericalIntegral1SolveODE(f, x(A), y(A), (-x_{max}), delta) → numericalIntegral2SolveODE(f, x(B), y(B), x_{max}, delta) → numericalIntegral3SolveODE(f, x(B), y(B), x_{min}, delta) → numericalIntegral4SolveODE(f, x(C), y(C), x_{max}, delta) → numericalIntegral5SolveODE(f, x(C), y(C), x_{min}, delta) → numericalIntegral6SolveODE(f, x(D), y(D), x_{max}, delta) → numericalIntegral7SolveODE(f, x(D), y(D), x_{min}, delta) → numericalIntegral8
AI Drawing Prompt Reference
Plot a direction field for a given differential equation and display particular solutions. Start by inputting the equation and coordinate range to generate the direction field. Then, based on initial conditions, draw several solution curves passing through different points to illustrate how solutions evolve over time.
The prompt above was compiled from the original drawing commands and is for reference only.