
Quadratic Function Graphing by Dr Adrian Jannetta
Loading the math board and drawing, please wait…
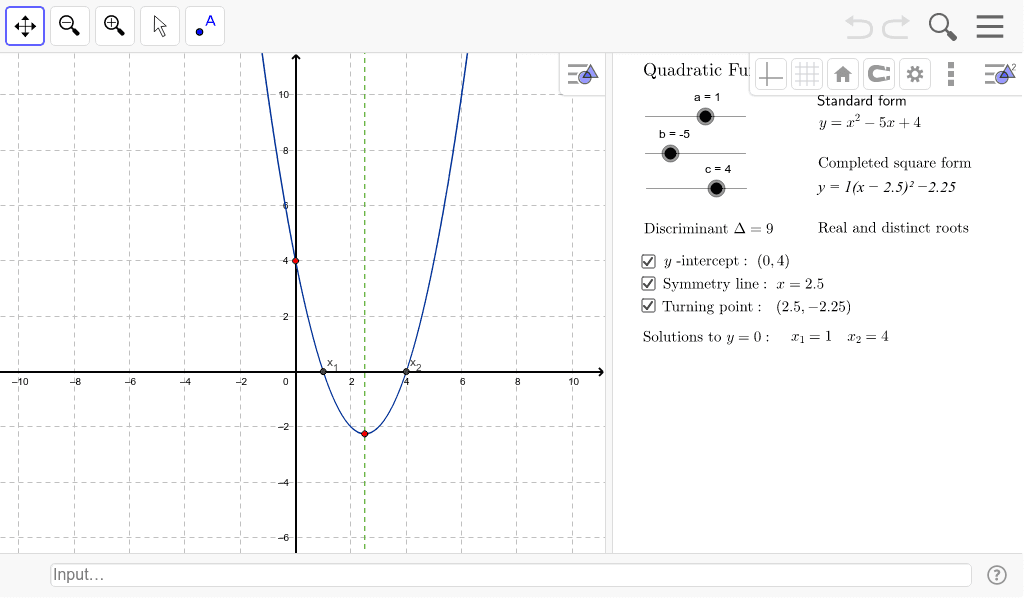
This example demonstrates how to dynamically plot the quadratic function y=ax^2+bx+c using sliders to control parameters a, b, and c. Key math concepts include quadratic functions, the impact of coefficients on graph shape and position, and parabola properties. Construction highlights involve using sliders for parameter control, Simplify for expression simplification, Intersect for intersection points, and Graphing for function plotting. Suitable for high school mathematics education to visually understand the relationship between parameters and graph characteristics.
GeoGebra Commands & Parameters
Simplify(text2) → text3Intersect(q, xAxis, 2) → AIntersect(q, xAxis, 1) → B
AI Drawing Prompt Reference
Create a dynamic graph of the quadratic function y=ax^2+bx+c, using sliders to control parameters a, b, and c, showing how changes in coefficients affect the parabola's shape and position. Key elements include sliders, a simplified function expression, and intersection points with the x-axis. First plot the function curve, then find the intersection points with the x-axis, and finally adjust parameters dynamically using sliders to observe graph changes.
The prompt above was compiled from the original drawing commands and is for reference only.