
Gradient and Intercept for Straight Lines
Loading the math board and drawing, please wait…
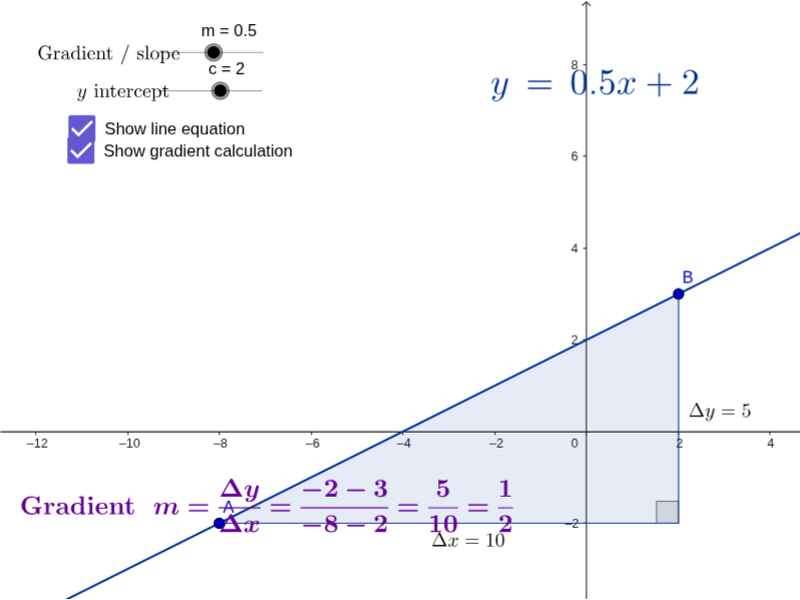
This example demonstrates how changing the gradient and y-intercept affects the graph of a straight line. It also shows how the gradient is calculated from two points. The core math concepts involved include the equation of a line, gradient, and intercept. GeoGebra commands and objects like Point, Polygon, Angle, FractionText, and LaTeX are used to create points and polygons, measure angles, display fraction text, and render mathematical formulas during construction. Suitable for high school students learning analytical geometry and understanding the meaning of line equations and their parameters.
GeoGebra Commands & Parameters
Point(a) → APoint(a) → BPolygon(A, P, B) → poly1, b_1, a_1, pAngle(B, P, A) → αFractionText(m) → text6LaTeX(a) → text7
AI Drawing Prompt Reference
Draw a straight line through two points and display its gradient and y-intercept. Use sliders to adjust the gradient and intercept to see how the line changes. Also, mark two points on the line and calculate the gradient between them. Display the gradient as a fraction and in mathematical formula form, and show the intersection points of the line with the coordinate axes using shapes.
The prompt above was compiled from the original drawing commands and is for reference only.