
Derivatives and Stationary Points
Loading the math board and drawing, please wait…
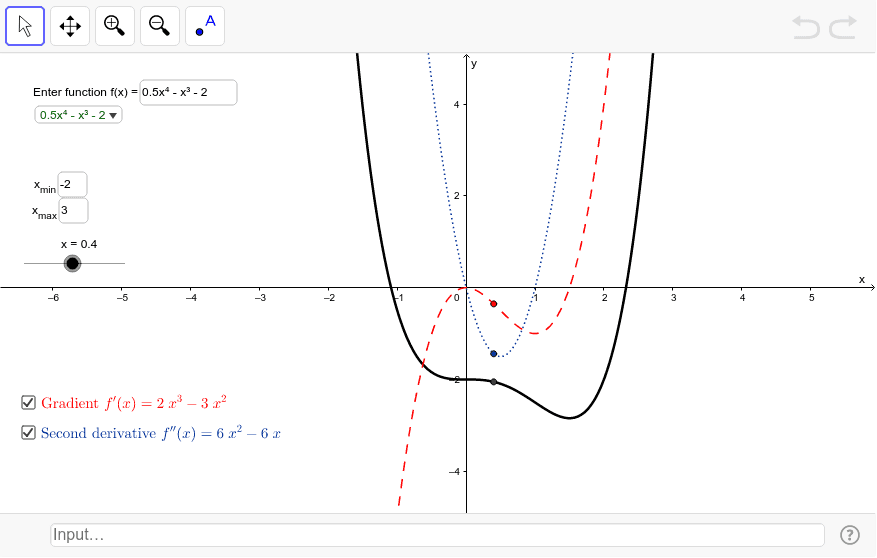
Explore the relationship between functions and their stationary points through graphs of the first and second derivatives. This example covers the core concept of derivatives and demonstrates how to understand the properties of functions by constructing first and second derivatives. It uses commands like Textfield, Simplify, and SelectedElement, suitable for high school mathematics education.
GeoGebra Commands & Parameters
Textfield(f) → inputBox1Simplify(Derivative[f]) → gSimplify(Derivative[g]) → hTextfield(p_1) → inputBox2Textfield(p_2) → inputBox3SelectedElement(List) → c
AI Drawing Prompt Reference
Draw the graph of a function f(x) and its first derivative g(x) and second derivative h(x). Use inputBox1 to input the function f(x), inputBox2 for the zero points of g(x), and inputBox3 for the zero points of h(x). First input f(x), then calculate and display its first derivative g(x), next calculate and display the second derivative h(x) of g(x), and finally mark the zero points of g(x) and h(x) on the graph.
The prompt above was compiled from the original drawing commands and is for reference only.