
Slope Demonstration
Loading the math board and drawing, please wait…
In collections
A1.ACE.1 - Create and solve equations and inequalities
Expressing Geometric Properties with Equations (GPE) Cluster
Slope
Graphing Linear Equations
Graphing Linear Equations
Graphing Linear Equations
Graphing Linear Equations
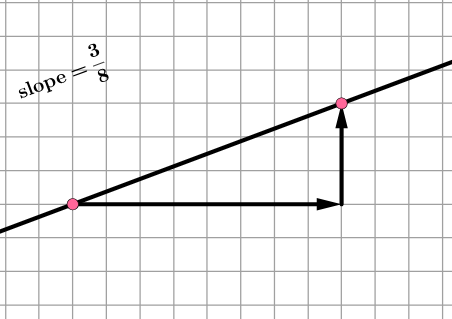
This example dynamically illustrates the concept of slope. Key mathematical concepts include slope, coordinate system, and vector. It uses commands like PointIn, Line, Point, If, Polygon, Vector, and Slope in GeoGebra. Suitable for middle school and above students to learn about slope and coordinate geometry.
GeoGebra Commands & Parameters
PointIn(x ≥ x(A)) → BLine(A, B) → fPoint(Segment[A, B]) → CIf(y(B) ≥ y(A), (x(B), y(A)), (x(A), y(B))) → DPolygon(A, D, B) → t1, b, a, dVector(A, D) → uVector(D, B) → vIf(y(B) ≥ y(A), Midpoint[D, B], Midpoint[A, D]) → EIf(y(B) ≥ y(A), Midpoint[A, D], Midpoint[D, B]) → FSlope(Line[A, B]) → hNumerator(h) → iDenominator(h) → jIf(y(B) ≥ y(A), C + (j, 0), C + (0, i)) → GIf(y(B) ≥ y(A), G + (0, i), G + (j, 0)) → HPolygon(C, G, H) → t2, h_1, c_1, g_1Vector(C, G) → wVector(G, H) → kIf(y(B) ≥ y(A), Midpoint[C, G], Midpoint[G, H]) → IIf(y(B) ≥ y(A), Midpoint[G, H], Midpoint[G, C]) → JRotateText(text1, atand(Slope[f])) → text2RotateText(text5, atand(Slope[f])) → text3
AI Drawing Prompt Reference
Draw a coordinate system with point A and point B on the right side of A. Draw a line f through points A and B. Take a point C on the line segment AB. Construct a parallelogram t1 based on points A and B. Draw vectors u and v from A to D and from D to B. Construct points E and F as the midpoints of line segments AD and DB. Calculate the slope h of line AB and decompose it into numerator i and denominator j. Construct points G and H based on the slope h, located on opposite sides of line AB. Draw vectors w and k from C to G and from G to H. Construct points I and J as the midpoints of line segments CG and GH. Finally, rotate text to display the angle of the slope.
The prompt above was compiled from the original drawing commands and is for reference only.