
Slope Demonstration by Malin Christersson
Loading the math board and drawing, please wait…
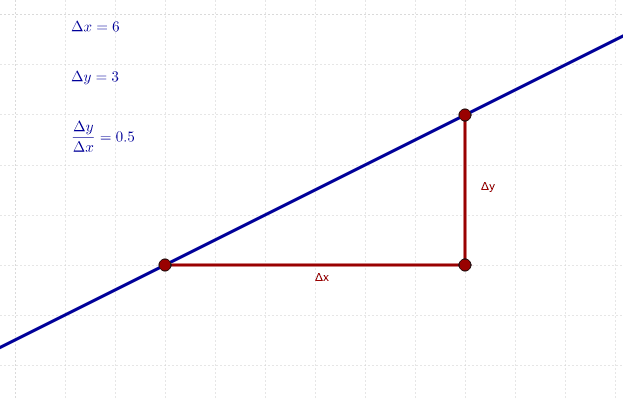
This example demonstrates the calculation and visualization of slope through points and line segments. It involves core mathematical concepts like slope, linear regression, and median line. Constructed using GeoGebra commands such as Line, Point, Segment, and If, it is suitable for high school mathematics teaching and function graph analysis, helping students understand the application of slope in geometry and functions.
GeoGebra Commands & Parameters
Line(A, xAxis) → aPoint(a) → BLine(B, yAxis) → bPoint(b) → CSegment(A, B) → cSegment(B, C) → dLine(A, C) → eIf(Slope[e] ≥ 0, Length[d], (-Length[d])) → negD
AI Drawing Prompt Reference
Draw a coordinate system with points A and B, where A is on the x-axis and B is on the y-axis. Connect A and B to form segment c, then connect B and C to form segment d. Draw a line e through points A and C. If the slope of line e is greater than or equal to 0, keep the length of segment d; otherwise, take the negative of the length of segment d to form segment negD.
The prompt above was compiled from the original drawing commands and is for reference only.