
Slope and Road Signs
Loading the math board and drawing, please wait…
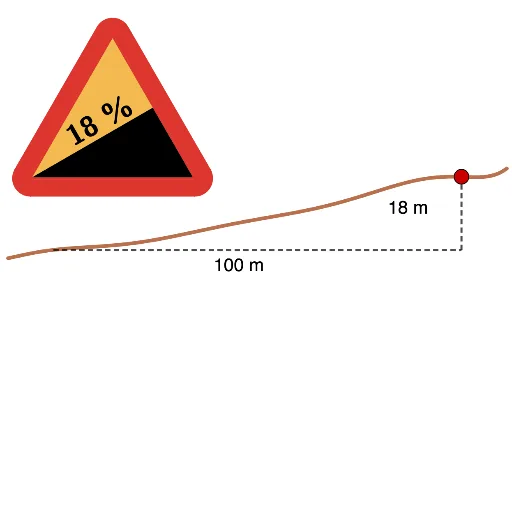
This example visually demonstrates the relationship between slope and road signs, linking linear function graphs to real-world road标志. It covers core concepts like linear functions, slope, linear regression, and real number operations. Construction highlights GeoGebra commands such as Point, OrthogonalLine, Vector, FitPoly, Segment, Polygon, Circle, Intersect, CircleSector, CurveCartesian, Midpoint, and RotateText. Ideal for high school mathematics education, focusing on linear function applications and data analysis in practical scenarios.
GeoGebra Commands & Parameters
Point(xAxis) → BOrthogonalLine(B, xAxis) → fPoint(f) → A11Vector(A2, A11) → uFitPoly(L_1, 8) → gSegment((0, 0), (100, 0)) → hSegment((100, 0), A11) → iOrthogonalLine(A, yAxis) → jPoint(j) → CPolygon(A, C, 3) → poly1, k, l, m, DOrthogonalLine(C, xAxis) → nOrthogonalLine(C, l) → pOrthogonalLine(D, l) → qOrthogonalLine(D, m) → rOrthogonalLine(A, m) → sCircle(A, a) → cOrthogonalLine(A, xAxis) → tIntersect(c, t, 1) → EIntersect(c, s, 1) → FCircle(D, a) → dIntersect(d, r, 1) → GIntersect(d, q, 1) → HCircle(C, a) → eIntersect(e, p, 1) → IIntersect(e, n, 1) → JPolygon(E, J, C, A) → q1, e_1, j_1, c_1, a_1Polygon(C, I, H, D) → q2, c_2, i_1, h_1, d_1Polygon(A, D, G, F) → q3, a_2, d_2, g_1, f_1CircleSector(C, J, I) → k_1CircleSector(D, H, G) → p_1CircleSector(A, F, E) → q_1CurveCartesian(t, g(t), t, x(A1), x(A12)) → bMidpoint(A, D) → KMidpoint(D, C) → LPolygon(A, K, C) → t1, c_3, a_3, k_2Polygon(A, C, L) → t2, l_1, a_4, c_4RotateText(text3, π / 6) → text4RotateText(text3, ((-π)) / 6) → text5Midpoint(i) → M
AI Drawing Prompt Reference
Draw a graph showing the relationship between slope and road signs, including linear function graphs and real-world road signs. Start with x and y axes, then draw a line perpendicular to the x-axis and mark its intersection point. Construct slope using vectors and fit data points to create a linear function graph. Add triangular road signs, construct symbols using circles and their centers, and draw sectors. Finally, connect key points to form closed shapes and rotate text annotations for angles.
The prompt above was compiled from the original drawing commands and is for reference only.