
Sliding Sine: Area Change under Transformation
Loading the math board and drawing, please wait…
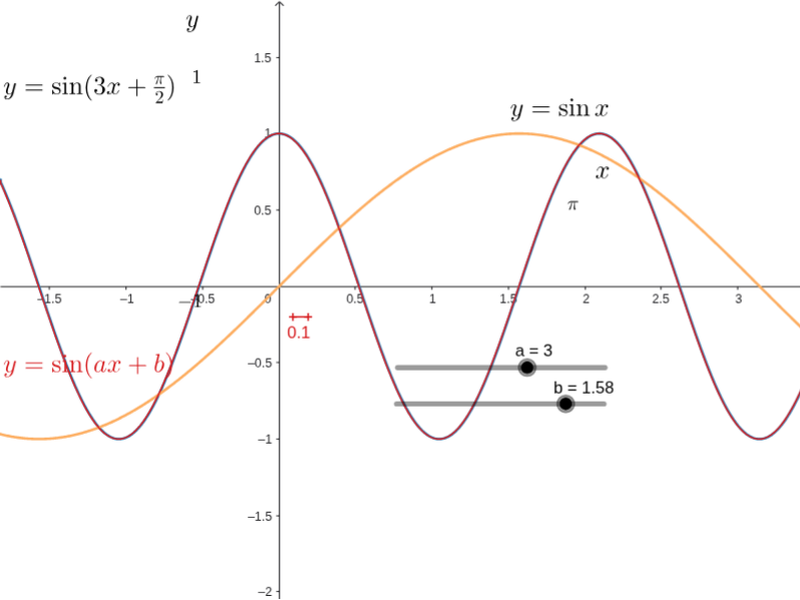
This example demonstrates how the area changes when the sine function is transformed via sliding. Key mathematical concepts include integration, function transformation, and geometric area calculation. Construction involves GeoGebra commands like Integral and Segment to create the graph, with slider animation showing dynamic changes. Suitable for high school students learning calculus fundamentals and function transformation applications.
GeoGebra Commands & Parameters
Integral(f, ((-π)) / 6, π / 6) → a_1Integral(g, 0, π) → b_1Integral(h, (π - b) / a, (0 - b) / a) → cIntegral(g, 1.85, 2.15) → eIntegral(f, (1.85 - π / 2) / 3, (2.15 - π / 2) / 3) → dIntegral(h, (1.85 - b) / a, (2.15 - b) / a) → iSegment(Q, P) → j
AI Drawing Prompt Reference
Please draw a graph that demonstrates how the area changes when the sine function is transformed via sliding. The graph includes three different integral regions, corresponding to the integrals of the sine function, another unknown function, and a third unknown function. These integral regions are bounded by sliders, showing dynamic changes in area calculation. Additionally, include a segment connecting two key points to further illustrate the geometric construction of the changing areas.
The prompt above was compiled from the original drawing commands and is for reference only.