
Slider Tool Usage Example
Loading the math board and drawing, please wait…
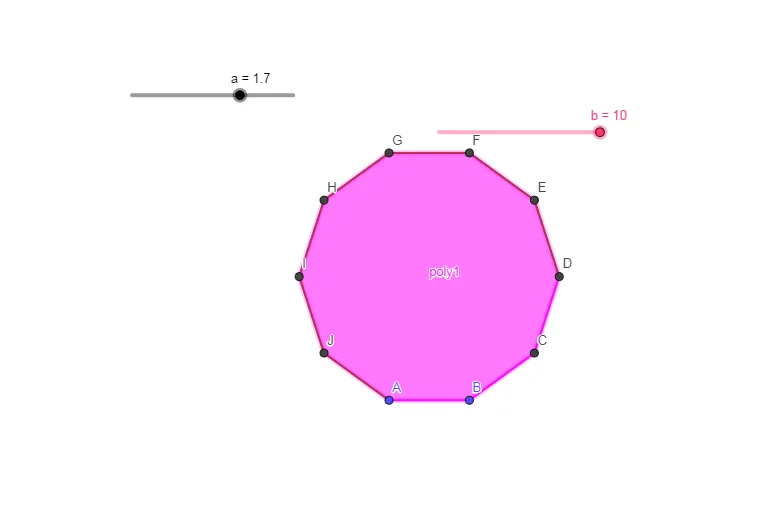
This example demonstrates the changes in polynomial function graphs using the slider tool. Key mathematical concepts include polynomial functions and geometric transformations. Using GeoGebra commands like Polygon, f, g, h, etc., the example dynamically shows the changes in function graphs. Suitable for high school mathematics education and learning.
GeoGebra Commands & Parameters
Polygon(A, B, b) → poly1, f, p, C, D, E, F, G, H, I, J, g, h, i, j, k, l, m, n
AI Drawing Prompt Reference
Illustrate how polynomial function graphs change with a sliding parameter, using a polygon tool to draw function images and show geometric transformation effects, suitable for high school mathematics education.
The prompt above was compiled from the original drawing commands and is for reference only.