
Sketching Compressions of Parabolas
Loading the math board and drawing, please wait…
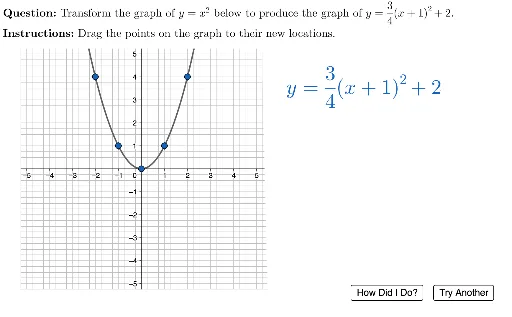
This example demonstrates how to sketch and analyze compressions of parabolas using GeoGebra. It involves core math concepts like parabolas, quadratic equations, optimization problems, and linear equations. Key GeoGebra commands and objects used in the construction include Polygon, PointIn, Element, LaTeX, and FitPoly. Suitable for high school and above students to understand function transformations and optimization problems.
GeoGebra Commands & Parameters
Polygon({(-5.25, -5.25), (-5.25, 5.25), (5.25, 5.25), (5.5, -5.25)}) → viewBoxPointIn(viewBox) → CPointIn(viewBox) → APointIn(viewBox) → BPointIn(viewBox) → EPointIn(viewBox) → DElement(questionList, questionListIndex) → questionNumLaTeX(UnicodeToLetter[10007]) → xmarkLaTeX(UnicodeToLetter[10003]) → cmarkElement(P2:P11, questionNum) → correctPointsElement(D2:D11, questionNum) → functionTextLaTeX((("\vphantom{\left(\tfrac{1}{2}\right)}" * functionText) * "")) → displayEquationLaTeX((((("\text{" * QUESTION) * "\\") * INSTRUCTIONS) * "}")) → TEXTFitPoly(startingPoints, 2) → fPolyFitPoly(correctPoints, 2) → gPolyDottedFitPoly(usersPoints, 2) → gPolySolidElement(A2:A11, questionNum) → aElement(B2:B11, questionNum) → hElement(C2:C11, questionNum) → k
AI Drawing Prompt Reference
To draw a graph of compressed parabolas. First, create a rectangle as the viewBox. Then, place points A, B, C, D, E. Next, add text elements like xmark, cmark, displayEquation, and TEXT. Finally, use FitPoly to fit parabolas, generating fPoly, gPolyDotted, and gPolySolid.
The prompt above was compiled from the original drawing commands and is for reference only.