
Sine with Sine Slider
Loading the math board and drawing, please wait…
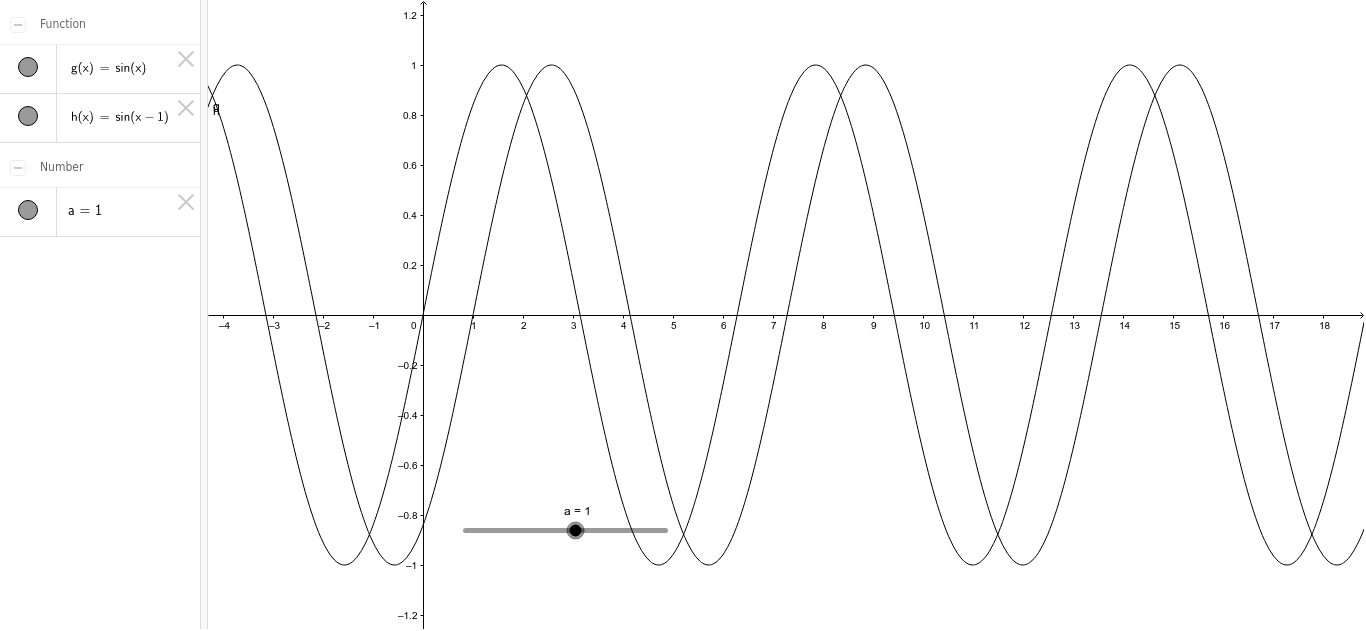
This example displays two sine graphs, the first one is fixed while the phase shift of the second sine graph is controlled by a slider. By moving the slider, users can observe the horizontal translation of the sine wave, reinforcing the concepts of periodicity and phase shift in trigonometry. The construction uses the sine function object g, a slider a for the phase parameter, and object h to generate the second sine graph, demonstrating dynamic function graphing. It is suitable for high school mathematics instruction and exploratory learning of function behavior.
GeoGebra Commands & Parameters
g(x) = sin(x)Numeric a(1.0)h(x) = sin(x - a)
AI Drawing Prompt Reference
Draw a fixed sine wave and a sine wave whose phase shift can be adjusted using a slider. First, plot y = sin(x). Then, create a slider named a with an initial value of 1. Use this slider to generate the second sine wave y = sin(x - a), and observe the effect of the phase shift on the sine wave.
The prompt above was compiled from the original drawing commands and is for reference only.