
Sine Function Transformation with Sliders
Loading the math board and drawing, please wait…
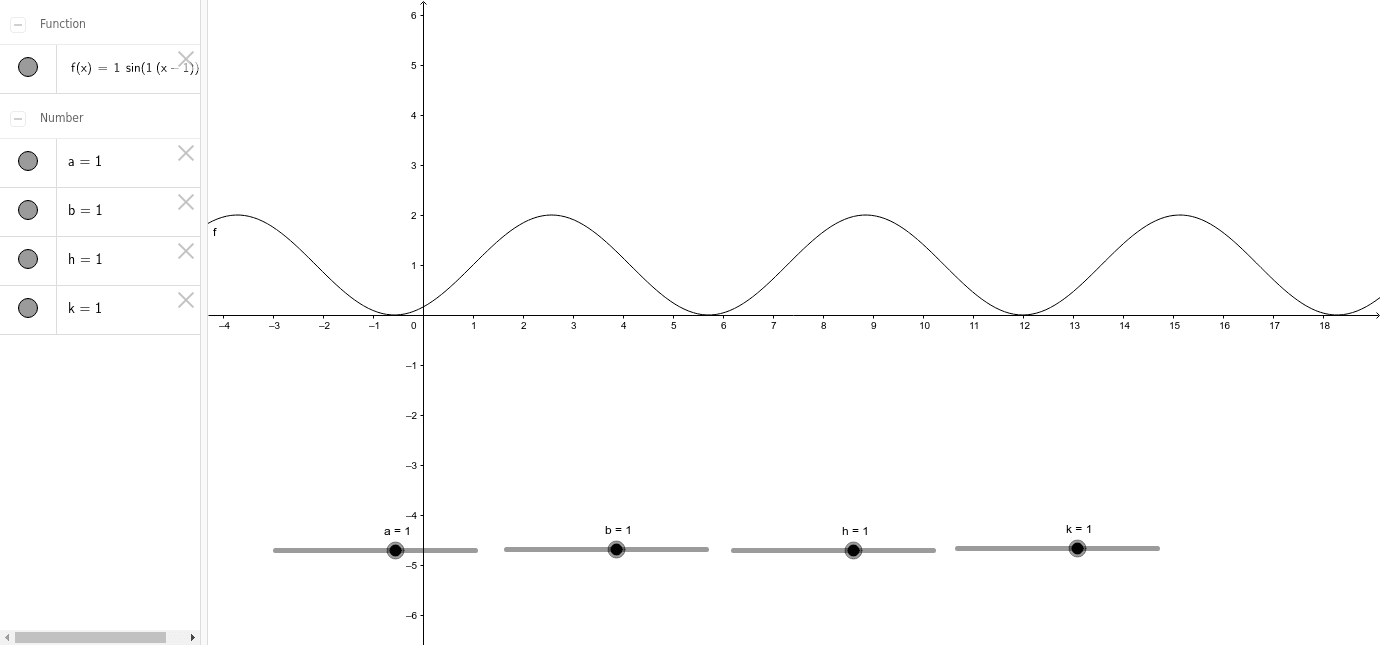
This GeoGebra example dynamically visualizes the sine function f(x) = a sin(b(x-h)) + k, using sliders to control the parameters a, b, h, and k. Students can experiment with how each parameter affects the graph's amplitude, period, phase shift, and vertical translation. The construction employs function objects, slider binding, and real-time graph updates in GeoGebra. It is designed for high school mathematics, particularly trigonometry and function transformation units, supporting both teacher-led demonstration and independent student exploration.
GeoGebra Commands & Parameters
Numeric a(1.0)Numeric b(1.0)Numeric h(1.0)Numeric k(1.0)f(x) = (a * sin((b * (x - h)))) + k