
Sine Wave Sounds Demo
Loading the math board and drawing, please wait…
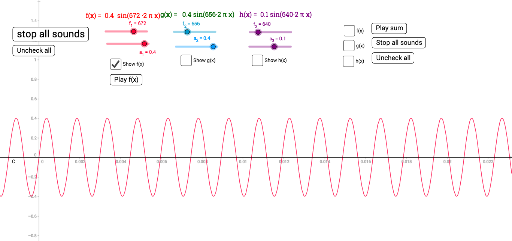
This example demonstrates the generation and visualization of sound from sine waves. It involves core mathematical concepts like trigonometry, continuity, limits, and stochastic processes. The construction uses GeoGebra commands/objects such as a_2, f_2, a_1, f_1, g, f, buttons, sliders, and text elements. Suitable for high school and above to understand the relationship between sound and mathematical functions dynamically.
GeoGebra Commands & Parameters
Numeric a_2(0.4)Numeric f_2(656)Numeric a_1(0.4)Numeric f_1(672)g(x) = (a_2 * sin((((f_2 * 2) * π) * x)))f(x) = (a_1 * sin((((f_1 * 2) * π) * x)))Boolean a(true)Boolean b(false)Boolean c(false)Numeric a_3(0.1)Numeric f_3(640)h(x) = (a_3 * sin((((f_3 * 2) * π) * x)))Boolean d(true)Boolean e(false)Boolean i(false)Boolean j(false)Boolean k(false)Boolean l(false)C(x) = (j * f(x)) + (k * g(x)) + (l * h(x))
AI Drawing Prompt Reference
Create a sine wave sound demonstration graph with two sine waves of different frequencies and amplitudes, and an optional third sine wave. First, draw a sine wave with a frequency of 672 and an amplitude of 0.4. Then, draw another sine wave with a frequency of 656 and an amplitude of 0.4. Finally, based on the button selection, add a third sine wave with a frequency of 640 and an amplitude of 0.1.
The prompt above was compiled from the original drawing commands and is for reference only.