
Sine Wave Demonstration
Loading the math board and drawing, please wait…
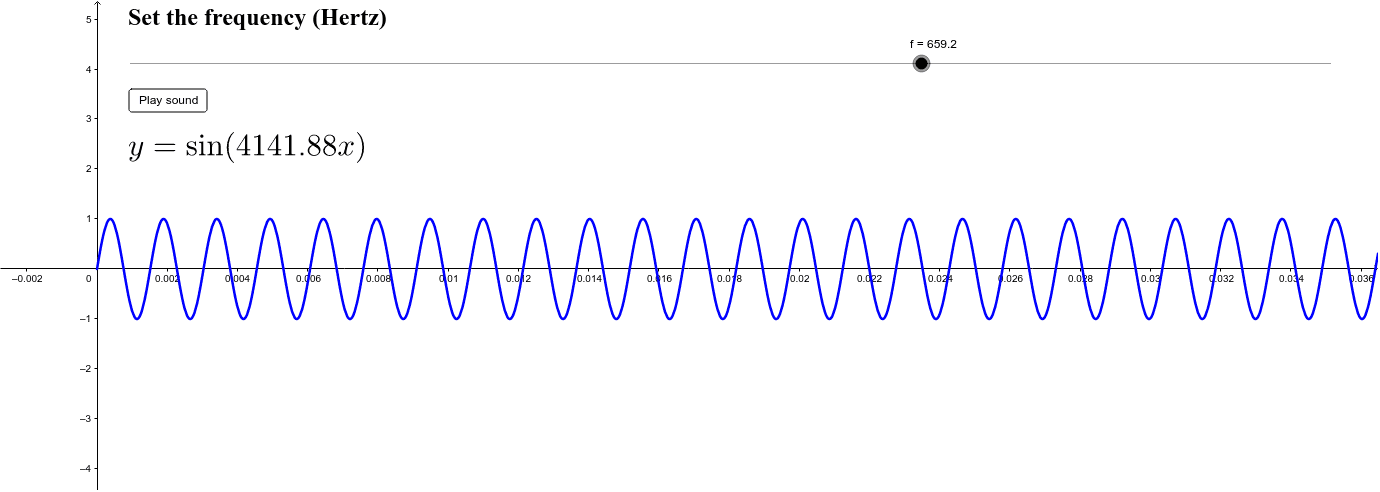
This example demonstrates the graph of the sine function and its dynamic behavior. It involves core mathematical concepts like the sine function, coordinate geometry, integral, and parametric equations. Construction highlights include the use of GeoGebra's function command, button, and text objects. Suitable for high school mathematics teaching and function graph learning.
GeoGebra Commands & Parameters
Function(sin((((2 * π) * f) * x)), 0, (10 * π / f)) → h
AI Drawing Prompt Reference
Draw a sine wave graph with the x-axis range from 0 to 10π, and frequency f. First, define the frequency f, then use the function command to plot the sine wave, with the x-coordinate multiplied by 2π and the frequency f.
The prompt above was compiled from the original drawing commands and is for reference only.