
Play Two Tones Sine Wave – Interactive Audio and Graph Demonstration
Loading the math board and drawing, please wait…
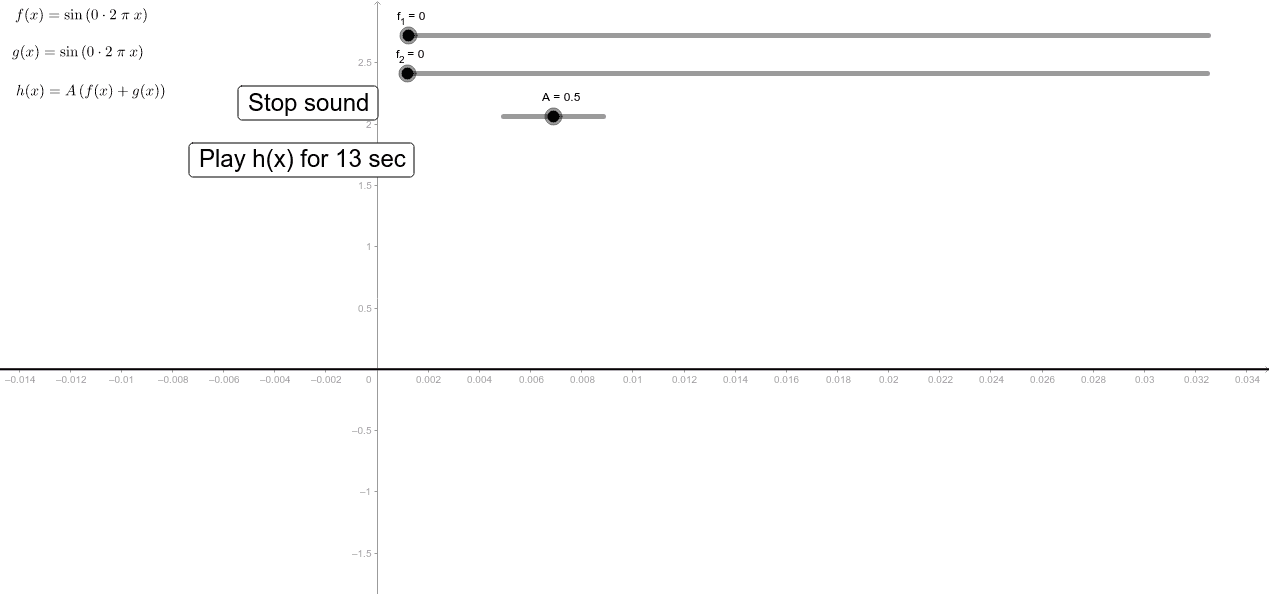
This example demonstrates how to create two sine waves in GeoGebra and play their corresponding audio tones. Users can adjust amplitude A and frequency h via sliders to see the waveform changes in real time, and use buttons to control playback and pause. The core mathematical concepts include the properties of sine functions, the relationship between frequency and period, and the effect of amplitude on waveforms. The construction mainly uses objects f_1 and f_2 for the two sine waves, g for combined display, A and h as parameter sliders, button1 and button2 for play/pause functions, and text1, text2, text3 to show current amplitude, frequency, and waveform information. This example is suitable for high school or first‑year university students learning sine functions and their graphical representations, as well as for introductory audio signal processing courses, offering both visual and auditory feedback to enhance intuitive understanding.
GeoGebra Commands & Parameters
Numeric f_1(0.0)Numeric f_2(0.0)g(x) = sin((((f_2 * 2) * π) * x))f(x) = sin((((f_1 * 2) * π) * x))Numeric A(0.5)h(x) = (A * (f(x) + g(x)))